


To choose the right statistical test in research, answer four questions in order: (1) what is your research goal — comparing groups, testing a relationship, or predicting an outcome; (2) how many variables do you have and which are independent vs dependent; (3) what is each variable’s level of measurement (nominal, ordinal, interval or ratio); and (4) does your data meet the assumptions for a parametric test? Match those answers against the decision table below and you will arrive at the correct test almost every time.
A statistical test is a formal procedure that uses sample data to decide between two competing claims about a population: the null hypothesis (no effect, no difference, no relationship) and the alternative hypothesis. The test produces a p-value — the probability of observing your result, or one more extreme, if the null hypothesis were true. A small p-value (conventionally below 0.05) gives evidence against the null. For a deeper treatment of how tests generalise from sample to population, see our guide to inferential statistics.
This article walks through the decision framework step by step, gives a complete decision table, and explains when to use parametric versus non-parametric tests so you can defend your choice in any dissertation or research paper.
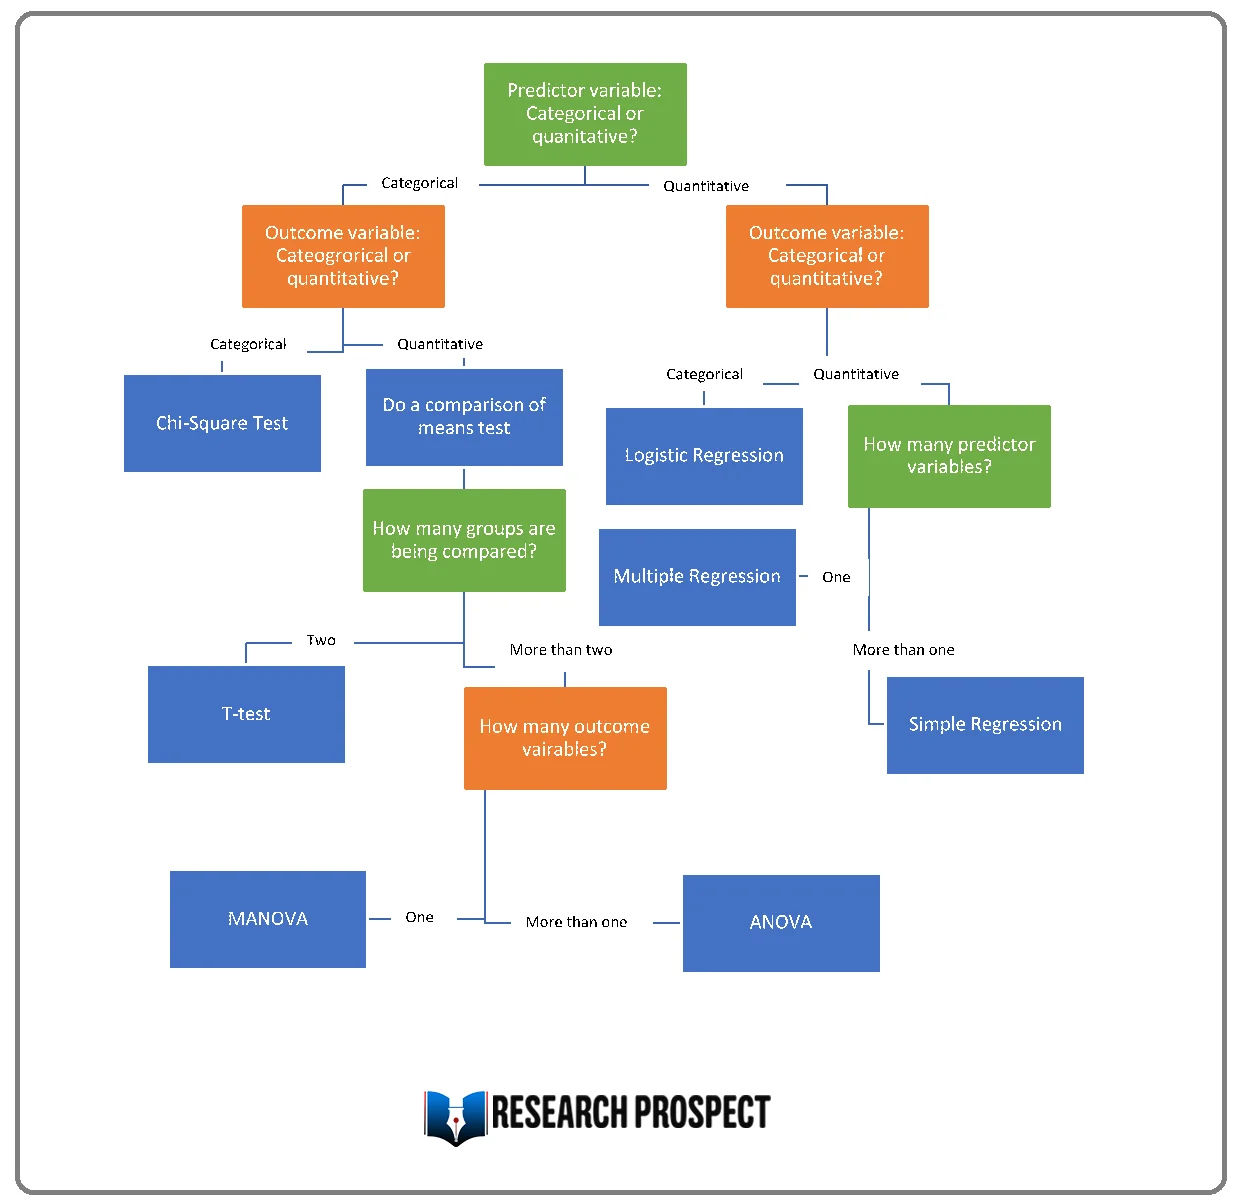
Already know your variables and their measurement levels? Use the decision flowchart below to pick the correct statistical test for your data.
Choosing a Statistical Test — Quick Decision Guide
2 groups → Independent t-test
3+ groups → One-way ANOVA
Same group, 2 times → Paired t-test
2 continuous → Pearson correlation / regression
Ranked/ordinal → Spearman
2 categorical variables → Chi-square test
Small expected counts → Fisher’s exact
What a Statistical Test Does
According to Greenland et al. (2016), a statistical test computes a test statistic — a single number (such as a t, F or χ² value) that summarises how far your sample result departs from what the null hypothesis predicts. The test then converts that statistic into a p-value, the probability of seeing a departure at least this large if the null hypothesis were true.
The larger the test statistic (relative to its reference distribution), the smaller the p-value, and the stronger the evidence against the null hypothesis. If the p-value falls below your chosen significance level α (commonly 0.05), the result is declared statistically significant; if it does not, you fail to reject the null. Note that failing to reject the null is not the same as proving it true.
The Decision Framework: Four Questions
Before running any test, your data must be collected in a statistically valid way — ideally through probability sampling via an experiment or structured observation. A larger, representative sample improves the validity of your inference. Once you have valid data, work through these four questions:
The Three Core Parametric Assumptions
Independence of observations: each data point is unrelated to the others (no repeated or clustered measurements unless the test explicitly accounts for them).
Homogeneity of variance: the groups being compared have approximately equal variances (homoscedasticity).
Normality: the outcome (or the model residuals) is approximately normally distributed — this applies to interval/ratio data. When normality and homogeneity fail, a non-parametric test is the safer choice (Awang, Afthanorhan and Asri, 2015).
“Researchers must consider these assumptions when choosing a statistical test; when the assumptions are not met, the test results may be invalid.” — Mishra et al. (2019), Annals of Cardiac Anaesthesia
The stakes are real: a methodological review by Mishra et al. (2019) reported that roughly half of published biomedical studies use at least one incorrect statistical test, most often by applying a parametric test to data that violate its assumptions. According to Bevans (2020), correctly classifying your variables is what leads you to the right test. The two broad families are quantitative (numeric) and categorical variables.
A quantitative variable records a number and is either continuous (can take any value within a range, e.g. 0.5 grams of gold) or discrete (whole-number counts, e.g. 1 car). A categorical variable records group membership and is ordinal (ordered categories, e.g. low/medium/high), nominal (unordered names, e.g. blood type), or binary (two outcomes, e.g. yes/no).
The Statistical Test Decision Table
The table below maps the most common research scenarios to the correct test. Read it as: goal + variables + measurement level → test. Where parametric assumptions fail, switch to the non-parametric equivalent in the final column.
| Your goal | Variables / groups | Outcome measurement | Parametric test | Non-parametric equivalent |
|---|---|---|---|---|
| Compare a mean to a known value | 1 group | Interval/ratio | One-sample t-test | One-sample Wilcoxon signed-rank test |
| Compare 2 independent group means | 1 categorical IV (2 groups), 1 quantitative DV | Interval/ratio | Independent-samples t-test | Mann–Whitney U (Wilcoxon rank-sum) test |
| Compare 2 related/paired means | Same subjects, 2 conditions | Interval/ratio | Paired-samples t-test | Wilcoxon signed-rank test |
| Compare 3+ independent group means | 1 categorical IV (3+ groups), 1 quantitative DV | Interval/ratio | One-way ANOVA | Kruskal–Wallis H test |
| Compare 3+ related group means | Repeated measures, 3+ conditions | Interval/ratio | Repeated-measures ANOVA | Friedman test |
| Compare means across 2+ factors | 2+ categorical IVs, 1 quantitative DV | Interval/ratio | Two-way (factorial) ANOVA | — (use rank-based/robust models) |
| Compare means on 2+ outcomes at once | 1+ categorical IV, 2+ quantitative DVs | Interval/ratio | MANOVA | — |
| Strength/direction of a relationship | 2 continuous variables | Interval/ratio | Pearson correlation (r) | Spearman’s rank correlation (ρ) |
| Predict a continuous outcome | 1 continuous IV, 1 continuous DV | Interval/ratio | Simple linear regression | — |
| Predict a continuous outcome from many predictors | 2+ IVs, 1 continuous DV | Interval/ratio | Multiple linear regression | — |
| Predict a binary outcome | 1+ IVs, 1 binary DV | Nominal (2 outcomes) | Logistic regression | — |
| Association between 2 categorical variables | 2 categorical variables | Nominal/ordinal | — | Chi-square test of independence (Fisher’s exact for small cells) |
Not sure which test fits your data?
ResearchProspect to the rescue!
Our statisticians will choose, run and interpret the correct test for your dissertation — see our statistical analysis service.

Selection of a Parametric Test
Bettany-Saltikov and Whittaker (2014) note that parametric tests rest on assumptions about the population the sample is drawn from — chiefly that the outcome is continuous and approximately normal, observations are independent, and group variances are similar. When those assumptions hold, parametric tests are more statistically powerful (more likely to detect a real effect) than their non-parametric counterparts. The three workhorse families are regression, comparison and correlation.
Regression tests model how one or more predictor (independent) variables explain a continuous dependent variable, and can be used for prediction. Simple linear regression has one predictor; multiple linear regression has two or more (Kazmi et al., 2017). Regression quantifies association and prediction; on its own it does not establish causation without a suitable research design.
Comparison tests test whether group means differ. A t-test compares the means of two groups — for example, the average income of men versus women (Kim, 2015). It comes in three forms: one-sample (mean vs a fixed value), independent-samples (two separate groups) and paired-samples (the same subjects measured twice). When you compare the means of three or more groups, the t-test no longer applies and you use ANOVA; MANOVA extends this to two or more dependent variables at once.
Correlation measures the strength and direction of the relationship between two variables (Bell, Bryman and Harley, 2018). When both variables are continuous and roughly linear, use Pearson’s correlation coefficient (r), which ranges from −1 (perfect negative) through 0 (no linear relationship) to +1 (perfect positive). For the relationship between two categorical variables you do not use correlation at all — you use the chi-square test of independence (covered below).
Selection of a Non-Parametric Test
Hair (2015) explains that when the data fail the parametric assumptions — or when the outcome is ordinal rather than interval/ratio — a non-parametric test is appropriate. These tests typically work on ranks rather than raw values, so they make fewer distributional assumptions, at the cost of somewhat lower power when the parametric assumptions would actually have held. Each parametric test has a recognised non-parametric counterpart:
| If the parametric test is… | Use the non-parametric test… | When |
|---|---|---|
| Independent-samples t-test | Mann–Whitney U (Wilcoxon rank-sum) | Two independent groups; ordinal or non-normal outcome |
| Paired-samples t-test | Wilcoxon signed-rank test | Two related/paired measurements |
| One-way ANOVA | Kruskal–Wallis H test | Three or more independent groups |
| Repeated-measures ANOVA | Friedman test | Three or more related conditions |
| Pearson correlation | Spearman’s rank correlation (ρ) | Ordinal data or a monotonic, non-linear relationship |
For categorical-versus-categorical questions, the chi-square test of independence assesses whether two nominal/ordinal variables are associated; when expected cell counts are very small, Fisher’s exact test is used instead. These sit outside the parametric/non-parametric pairing because no group means are involved.
Conclusion
Choosing a statistical test is a structured decision, not guesswork. Fix your research goal, count and classify your variables, identify each variable’s level of measurement, and check the parametric assumptions — independence of observations, homogeneity of variance and normality. If those assumptions hold, use the parametric test (t-test, ANOVA, Pearson correlation, regression); if they do not, or your outcome is ordinal, switch to the matching non-parametric test (Mann–Whitney U, Kruskal–Wallis, Wilcoxon, Spearman). For two categorical variables, use chi-square. Work through the decision table above and you will select a test you can justify to any examiner.
References
- Awang, Z., Afthanorhan, A., and Asri, M.A.M., 2015. Parametric and nonparametric approach in structural equation modeling (SEM): The application of bootstrapping. Modern Applied Science, 9(9), p.58.
- Bell, E., Bryman, A., and Harley, B., 2018. Business research methods. Oxford university press.
- Bettany‐Saltikov, J., and Whittaker, V.J., 2014. Selecting the most appropriate inferential statistical test for your quantitative research study. Journal of Clinical Nursing, 23(11-12), pp.1520-1531.
- Bevans, R., 2020. Choosing the Right Statistical Test: Types & Examples. Scribbr.
- Greenland, S., Senn, S.J., Rothman, K.J., Carlin, J.B., Poole, C., Goodman, S.N., and Altman, D.G., 2016. Statistical tests, P values, confidence intervals, and power: a guide to misinterpretations. European journal of epidemiology, 31(4), pp.337-350.
- Hair, J.F., 2015. Essentials of business research methods. ME Sharpe.
- Kazmi, R., Jawawi, D.N., Mohamad, R., and Ghani, I., 2017. Effective regression test case selection: A systematic literature review. ACM Computing Surveys (CSUR), 50(2), pp.1-32.
- Mishra, P., Pandey, C.M., Singh, U., Keshri, A., and Sabaretnam, M., 2019. Selection of appropriate statistical methods for data analysis. Annals of Cardiac Anaesthesia, 22(3), pp.297-301.
- Kim, T.K., 2015. T-test as a parametric statistic. Korean Journal of anesthesiology, 68(6), p.540.
- Sreejesh, S., Mohapatra, S., and Anusree, M.R., 2014. Business research methods: An applied orientation. Springer.


