


The independent variable is the one you change or that changes on its own (the cause), and the dependent variable is the one you measure to see the effect. A quick test: the independent variable comes first and is not influenced by anything else in the study, while the dependent variable “depends on” it and is what you record as your result.
For example, in the question “Jon’s mom’s age (m) is 38, 39, 40, 41 and the number of scarves (s) he has given her is 3, 4, 5, 6 — which variable is independent and which is dependent?” the answer is that age (m) is the independent variable and the number of scarves (s) is the dependent variable: the count of scarves depends on how many birthdays have passed, not the other way round. We unpack exactly why below.

Telling these two apart correctly is the foundation of sound experimental design: it determines what you manipulate, what you measure, and how you read cause and effect. Before we compare them in detail, let’s define what a variable is in the first place. (If you want the wider picture of variable types — categorical, numerical, discrete, continuous — see our guide to the types of variables; this article focuses specifically on the independent–dependent distinction.)
What Is a Variable in Statistics?
A variable is any characteristic, number or quantity that can be measured or counted and that can take on different values. It can be a physical quantity (time, temperature, speed), a count (number of customers, number of survived fish), or a more abstract attribute (satisfaction rating, exam score, preference for a YouTube channel).
For instance, if you measure how long an object takes to travel from point A to point B, the relevant variables are the time taken and the speed of the object. If you survey how people feel about different YouTube channels, your variables are the channel watched and the viewer’s rating of it.
In an experiment or study, the two roles that matter most are:
- Independent variable — what you change or control (the presumed cause).
- Dependent variable — what you measure as the outcome (the presumed effect).
“The dependent variable is the variable being tested and measured in an experiment, and is ‘dependent’ on the independent variable.” — Saul McLeod, Simply Psychology
What Is a Dependent Variable?
A dependent variable is the outcome you measure; its value depends on — and responds to — changes in another variable, usually the independent variable. When the independent variable shifts, the dependent variable is expected to shift in response.
The direction and size of that response are described by a function that represents the relationship between the two variables. In plain terms: you change the independent variable and record what happens to the dependent variable.
y = f(x) = 5x + 2
In this equation, y is the dependent variable and x is the independent variable; f(x) is the function that links them. Pick a value of x, and y is determined for you — that is exactly what “dependent” means. The dependent variable is sometimes called the response or outcome variable, because it captures the effect of the independent variable on your test units.
Common dependent variables include exam marks, plant height, reaction time, blood pressure, sales figures and survey ratings — anything you record as a result.
What data collection best suits your research?
- Find out by hiring an expert from ResearchProspect today!
- Despite how challenging the subject may be, we are here to help you.


What Is an Independent Variable?
An independent variable is the one whose value is not affected by the other variables in the study. Either the researcher sets it deliberately, or it changes on its own (like age or time) — but nothing else in the experiment changes it. Because it is used to predict or explain the outcome, it is also called the predictor or explanatory variable.
Age and time are classic examples: you cannot make time or a person’s age run faster or slower, so they sit independently of everything else. In the moving-object example, the time taken to reach a point depends on the object’s speed — here, speed acts as the independent variable that drives the outcome.
Put simply: the independent variable is what you change, and the dependent variable is what changes because of it.
Two related terms are worth knowing, because exam questions often hide variables behind them:
- Controlled variables — factors you deliberately keep constant (e.g. soil type, amount of water) so they don’t distort the result.
- Confounding variables — hidden factors that affect the dependent variable but were not accounted for, threatening the validity of your conclusion. Managing these is central to reliability and validity in research.
Independent vs Dependent: Key Differences
The table below summarises how the two roles compare at a glance.
| Feature | Independent Variable | Dependent Variable |
|---|---|---|
| Role | The presumed cause | The presumed effect |
| What you do with it | Change / manipulate / control it | Measure / record it |
| Also called | Predictor, explanatory, input | Response, outcome, predicted |
| Depends on the other? | No — stands alone | Yes — changes with the independent variable |
| Position in y = f(x) | x | y |
| Graph axis (convention) | x-axis (horizontal) | y-axis (vertical) |
| Example | Hours studied | Exam score |
Dependent and Independent Variables in Experiments
In any experiment, the independent variable is what the researcher changes and the dependent variable is what responds. The worked examples below show how to label them.
Experiment 1 — Fertiliser and plant growth: You want to find which fertiliser helps your plants grow tallest. You apply a different brand of fertiliser to each plant and measure how tall each one grows.
| Variable Type | In This Experiment |
|---|---|
| Independent variable | Brand of fertiliser (what you change) |
| Dependent variable | How tall the plant grows (what you measure) |
| Controlled variables | Water amount, sunlight, pot size, soil type |
Experiment 2 — Sea temperature and fish survival: You want to see how sea temperature affects fish. You set up two aquariums with water from the same site but held at different temperatures, then count how many fish survive.
| Variable Type | In This Experiment |
|---|---|
| Independent variable | Water temperature (what you set) |
| Dependent variable | Number of fish that survive (what you count) |
| Controlled variables | Water source, tank size, feeding, oxygen level |
Changing the dependent variable does not change the independent variable — counting more or fewer surviving fish does not alter the water temperature. The cause-and-effect arrow points one way: from independent to dependent.
A popular textbook question reads: “Jon buys his mom a scarf each birthday. The table shows his mom’s age (m) and the total number of scarves (s) he has given her.”
| Mom’s age (m) | 38 | 39 | 40 | 41 |
|---|---|---|---|---|
| Scarves (s) | 3 | 4 | 5 | 6 |
Answer: Mom’s age m is the independent variable and the number of scarves s is the dependent variable. Age advances on its own each year regardless of how many scarves exist, whereas the scarf total only grows because another birthday has passed — so s depends on m.
The rule (fill in the blank): “The dependent variable is always determined by the independent variable.”
Bonus — the relationship: at age 38 there are 3 scarves, so s = m − 35. Check: when m = 41, s = 41 − 35 = 6. ✓ Here m is the input (x) and s is the output (y), exactly as in y = f(x).
Is the Statistics assignment pressure too much to handle?
How about we handle it for you?
Put in the order right now in order to save yourself time, money, and nerves at the last minute.
How to Identify Which Variable Is Which
When a question doesn’t label the variables for you, work through these checks in order:
- Find the cause. Ask: “Which one do I change, set, or which one moves on its own (like time/age)?” That is the independent variable.
- Find the effect. Ask: “Which one am I measuring or counting as the result?” That is the dependent variable.
- Use the sentence test. Phrase it as “[Dependent] depends on [independent].” The version that makes sense tells you which is which. “Scarves depend on age” works; “age depends on scarves” does not.
- Spot the controls. Anything held constant is a controlled variable, not the independent one.
“An independent variable is the variable you manipulate or vary in an experimental study to explore its effects… A dependent variable represents the outcome of interest.” — Bhandari, P., Scribbr (2023)
Studies often have more than one independent variable. A factorial design with two independent variables (e.g. caffeine dose × sleep) lets you test each one’s effect plus their interaction; a design with three independent variables and one dependent variable is common in dissertations and is usually analysed with multiple regression or factorial ANOVA. Choosing the right test depends on how many variables you have and their measurement level — see our guide on which statistical test you should use and the broader levels of measurement.
Struggling to define your study variables?
ResearchProspect to the rescue!
Our statisticians help you specify variables, choose the right test and run the numbers — explore our statistical analysis service.

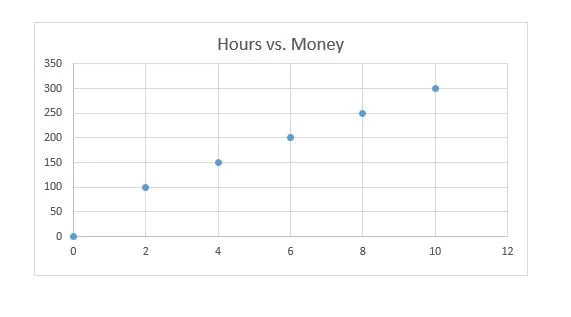
Dependent and Independent Variables in Graphs
Graphs follow a fixed convention, which makes them easy to read once you know the rule: the independent variable always goes on the horizontal x-axis, and the dependent variable on the vertical y-axis.
| Axis | Variable |
|---|---|
| X-axis (horizontal) | Independent variable |
| Y-axis (vertical) | Dependent variable |
Which axis?
- Plotted on the x-axis
- Manipulated / predictor
- Plotted on the y-axis
- Measured / outcome
This single convention works across scatter plots, line graphs and bar charts, so once you can name the independent and dependent variables you already know how to lay out the axes.


