


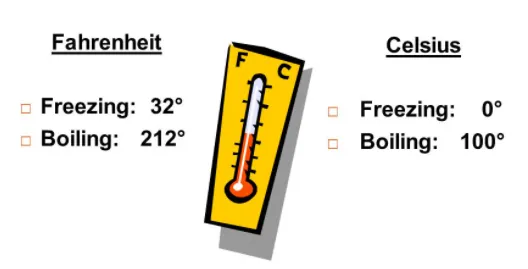
Interval data is a quantitative measurement scale where values sit at equal, fixed distances from one another but there is no true (meaningful) zero. Because the zero point is arbitrary rather than an absence of the quantity, you can meaningfully add and subtract interval values, but you cannot multiply or divide them or form valid ratios. Classic examples are temperature in degrees Celsius or Fahrenheit, IQ scores, and calendar years — and unlike most other data types, interval values can legitimately be negative.
Interval data is one of the four levels of measurement in statistics, sitting just below ratio data. Getting it right matters: the measurement level dictates which statistics and tests you are allowed to run on your numbers. Below we define interval data precisely, contrast it with ratio data, set out all four levels of measurement, work through a calculation, and answer the questions researchers ask most.
“With interval scales, the zero point is arbitrary… Because the zero point is not meaningful, the ratio of two interval scaled measurements has no meaning.” — Pennsylvania State University, STAT 100: Statistical Concepts and Reasoning
A note on this guide: we also publish a companion article on interval data characteristics and collection methods. This page focuses on the definition, worked examples and statistical analysis of interval data; head to the companion piece for a deeper treatment of how interval data is gathered in the field.
What Is Interval Data?
Interval data is numerical data measured on a scale where the gap between any two adjacent values is equal and constant, but where zero does not mean “none of the thing being measured”. The order of values is meaningful, the size of the differences between values is meaningful, but ratios are not.
Two properties define an interval scale:
- Equal intervals: the difference between consecutive values is identical everywhere on the scale. The jump from 10°C to 20°C is exactly the same size as the jump from 80°C to 90°C — a 10-degree change.
- No true zero (arbitrary zero): the zero point is a convention, not the absence of the quantity. 0°C does not mean “no temperature”; it is simply the freezing point of water chosen as a reference. Crucially, this allows interval data to take negative values — −5°C is a perfectly valid temperature.
Common examples of interval data:
- Temperature in Celsius or Fahrenheit — the difference between 1°C and 3°C equals the difference between 4°C and 6°C, and 0°C is arbitrary. (Temperature in Kelvin, by contrast, is ratio data, because 0 K is absolute zero — a genuine absence of thermal energy.)
- IQ scores — a 10-point gap is treated as equal across the scale, but an IQ of 0 is not defined, and a person with an IQ of 120 is not “twice as intelligent” as someone with an IQ of 60.
- Calendar years and dates — the year AD 0 is a reference point, not the beginning of time, and years can run negative (BC). The interval from 1990 to 2000 equals the interval from 2010 to 2020.
- Standardised exam scores on scales such as the SAT, where the zero is arbitrary.
- pH and many psychological rating scales designed to have equal intervals.
Because the zero is arbitrary, you can perform addition and subtraction on interval data but not multiplication or division. It is therefore wrong to say that 100°C is “twice as hot” as 50°C. The ratio 100:50 looks like 2:1, but converting the same two temperatures to Fahrenheit (212°F and 122°F) gives a ratio of roughly 1.7:1 — the “twice” claim falls apart, proving the ratio is meaningless. You can correctly say that 100°C is 50 degrees warmer than 50°C, because differences are valid.
The Four Levels of Measurement
There are four levels (or scales) of measurement in statistics, each one carrying more information than the last. They form a hierarchy: nominal, ordinal, interval, and ratio. Understanding where interval data sits is the key to choosing valid analyses.
The four levels of measurement.
| Level | Ordered? | Equal intervals? | True zero? | Example |
|---|---|---|---|---|
| Nominal | No | No | No | Blood type, gender, nationality |
| Ordinal | Yes | No | No | Race finishing position, Likert agreement |
| Interval | Yes | Yes | No (arbitrary) | Temperature in °C/°F, IQ, calendar years |
| Ratio | Yes | Yes | Yes | Weight, height, age, income, Kelvin |
Reading the table, interval data is distinguished by being ordered with equal intervals but without a true zero. That single missing property — the true zero — is what separates interval from ratio data and is the source of every rule about what you can and cannot calculate.
Interval Data vs Ratio Data
Interval and ratio data are close cousins: both are continuous, both have ordered values, and both have equal intervals between values. The one decisive difference is the true zero.
- Ratio data has a true zero. Zero genuinely means “none”. A weight of 0 kg means no mass; an income of £0 means no income. Because zero is fixed and meaningful, ratios are valid — 60 kg really is twice 30 kg. Ratio values cannot be negative.
- Interval data has an arbitrary zero. Zero is just a reference point on the scale, so it carries a value rather than signalling absence. Because of this, interval values can go below zero (e.g. −10°C), and ratios are not meaningful.
| Feature | Interval Data | Ratio Data |
|---|---|---|
| True zero | No (arbitrary) | Yes (means “none”) |
| Negative values | Allowed | Not possible |
| Add & subtract | Yes | Yes |
| Multiply, divide & form ratios | No | Yes |
| Example | Temperature (°C), IQ, years | Height, weight, age, income |
Characteristics of Interval Data
To summarise the defining features of interval data:
- Measured on an interval scale: values have a fixed order and direction, and the categories are quantitative rather than just labels.
- Equal intervals: the distance between each pair of adjacent values is the same across the whole scale.
- No true zero: the zero is arbitrary, so a variable can be measured below zero (negative values are valid).
- Permitted calculations: addition and subtraction are valid; multiplication, division and ratios are not. A full range of statistical analyses can still be applied, which is why interval data is widely used in scientific and market research.
How Is Interval Data Collected?
Interval data is gathered using both measurement instruments and survey tools. Common techniques include:
- Instrument readings: thermometers, clocks and standardised tests produce interval data directly (temperatures, times of day, IQ or exam scores).
- Interviews: structured, semi-structured or unstructured interviews — conducted face-to-face, by telephone, in panels or computer-assisted — can capture rating-scale responses designed to behave as interval data.
- Questionnaires and surveys: respondents answer a series of scaled items; carefully designed equal-interval rating scales (e.g. temperature-style “feeling thermometers”) yield interval data, and the responses are recorded for analysis.
For a fuller treatment of gathering this data type, see our companion guide on interval data characteristics and collection.
Analysing and Interpreting Interval Data
Because interval data supports addition and subtraction, it unlocks a rich toolkit of analysis — far more than nominal or ordinal data. Analysis falls into two broad families: descriptive statistics and inferential statistics.
Descriptive Statistics
Descriptive statistics summarise the data you have collected from a sample or population. The measures available for interval data include:
- Mean: the arithmetic average — add all values and divide by the number of values. (The mean is valid for interval data precisely because it relies only on addition and subtraction of equal intervals.)
- Median: the middle value when the data is ordered.
- Mode: the most frequently occurring value.
- Range: the difference between the highest and lowest value — see our guide to range in statistics.
- Standard deviation and variance: measures of how spread out the values are around the mean.
A researcher records the midday temperature (°C) on five winter days: −2, 0, 4, 6, 7.
Mean = (−2 + 0 + 4 + 6 + 7) ÷ 5 = 15 ÷ 5 = 3°C.
Median = the middle value of the ordered set (−2, 0, 4, 6, 7) = 4°C.
Range = highest − lowest = 7 − (−2) = 9°C.
Notice two things. First, the negative reading (−2°C) and a zero reading (0°C) are both valid data points — that is only possible because temperature is interval data. Second, every calculation used only addition and subtraction. It would be invalid to say the warmest day (7°C) was “seven times warmer” than 1°C, because that is a ratio, and ratios are meaningless on an interval scale.
Inferential Statistics
Inferential statistics use data from a sample to draw conclusions about a larger population. Interval data is well suited to powerful parametric tests, including:
- t-tests and ANOVA: compare means between two or more groups.
- Pearson correlation and linear regression: measure and model the relationship between interval variables.
- Trend analysis: uses past values to identify a pattern and project future behaviour over time.
- Conjoint analysis: a market-research method that estimates how consumers weigh different product features (price, specification, colour and so on) when making choices.
- TURF analysis (Total Unduplicated Reach and Frequency): assesses the combined market reach of a set of products or messages.
If you are unsure which test fits your variables, our guide on which statistical test to use walks through the decision by data type.
Struggling to analyse your interval data?
ResearchProspect to the rescue!
Our statisticians can run, interpret and write up the right tests for your data — explore our statistical analysis service.


