


Numerical data is information that is recorded as numbers and represents a measurable or countable quantity. Also called quantitative data, it answers questions of “how many” or “how much” — such as age, height, weight or the number of students in a class — and, unlike other number-coded data, you can carry out meaningful arithmetic (add, subtract, average) with it. Numerical data splits into two main types: discrete (counted in whole numbers) and continuous (measured on a scale).
In statistics, data is simply a collection of information gathered to describe a situation or test a hypothesis. Numerical data is one of the most widely used kinds because it can be summarised, compared and analysed mathematically. This article explains what numerical data means, why it matters, its two types and how to tell them apart, with worked examples and a quick comparison table.
What Is Numerical Data?
Numerical data, also known as quantitative data, is any data expressed as numbers that measure or count something. In other words, numerical data is information that contains a measurable or calculable value. The defining feature that separates it from numbers used merely as labels (for example, a jersey number or a postcode) is that arithmetic operations can be performed on it — you can total it, find its average, or measure the difference between two values and have the result make sense.
For comparison, categorical data (such as eye colour or nationality) places observations into groups and cannot be measured or meaningfully averaged. Numerical data sits among the levels of measurement at the interval and ratio levels.
Examples of numerical data include:
- Age
- Height
- Length
- Speed
- Weight
- IQ score
- Number of films watched
- Number of countries visited
- Number of smartphone users
Characteristics of Numerical Data
- Quantifiable: Numerical data is measurable or countable, which is exactly why it is also called quantitative data.
- Supports arithmetic: Operations such as addition and subtraction can be performed on the values, allowing you to calculate totals, means and differences.
- Equal intervals: On a numerical scale the gaps between consecutive values are equal (the difference between 10 and 11 is the same as between 50 and 51), which is what makes arithmetic valid.
- Easy to visualise: Numerical data can be displayed as histograms, dot plots, scatter plots and box plots, making patterns easy to see.
Importance of Numerical Data
Numerical data is central to research because almost all statistical analysis — from descriptive statistics such as the mean, median and mode to inferential tests — depends on numbers. It provides precise, comparable information and makes the analysis process more objective. Because it can be represented in charts and graphs, numerical data also helps businesses and organisations track performance and benchmark against competitors.
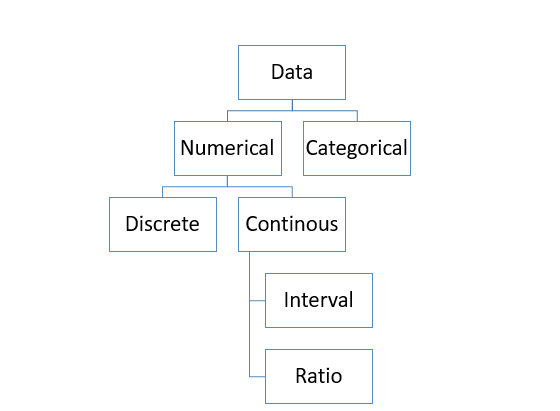
Types of Numerical Data
Numerical data is divided into two groups: discrete data and continuous data. The simplest test: if you can count it, it is discrete; if you can measure it on a scale, it is continuous. The table below summarises the difference before we look at each type in detail.
| Feature | Discrete data | Continuous data |
|---|---|---|
| Definition | Counted in whole numbers | Measured on a continuous scale |
| Possible values | Fixed, separate values only | Any value within a range, including decimals |
| Can be subdivided? | No (you cannot have half a person) | Yes (1.5 kg, 1.55 kg, 1.555 kg…) |
| Obtained by | Counting | Measuring |
| Examples | Number of children, number of cars sold, exam questions answered | Height, weight, time, temperature, distance |
| Typical charts | Bar charts, pie charts | Histograms, line graphs |
1. Discrete Data
Discrete data is numerical data made up of countable items — values you arrive at by counting rather than measuring. It takes whole-number values only, and those values cannot be meaningfully split into smaller parts. The set of possible values can be finite (for example, the number of students in a class, from 0 upwards) or infinite in principle (for example, the number of times a coin is tossed), but in every case the values are separate and distinct. The number of employees in a company is a classic example: you can count them, but you cannot have 12.5 employees.
Definition
Discrete data is numerical data that can only take certain fixed values, is obtained by counting, and cannot be subdivided into smaller parts.
Tip: Discrete quantities are usually phrased as “the number of…” — for example, the number of children, the number of press-ups, or the number of tulips in a vase.
Examples of Discrete Data
- The number of Android users in the UK
- The number of cars sold by a dealership in a month
- The number of cigarettes smoked per day
- The number of children in a family
- The number of seats won in Parliament
Characteristics of Discrete Data
Discrete data is widely used in statistical analysis because it gives concrete, unambiguous counts. Its key characteristics are:
- It consists of countable values — typically whole, non-negative numbers.
- Its values cannot be subdivided (no fractions or decimals of an actual item).
- It is obtained by counting, not measuring.
- It is easy to display using bar charts, pie charts and line charts.
Note: “count” variables such as the number of children are numerical and discrete. This is different from purely categorical variables such as gender or nationality, which group observations rather than counting them — the two are sometimes confused but are not the same thing.
2. Continuous Data
Continuous data is numerical data that can take any value within a range, including decimals. It represents measurements rather than counts, so between any two values there is always another possible value — you measure it rather than count it. Because it captures precision, continuous data can include fractions and decimals, which makes it valuable when researchers need accurate readings of a sample or population.
Definition
Continuous data is numerical data obtained by measurement that can take any value within a range, including decimal values, no matter how small the differences between them.
Examples of Continuous Data
- Time taken to finish a race
- Distance between two points
- The area of a field
- The weight of a newborn baby
- A person’s height
- Temperature
You can subdivide any of these values — a height of 1.7 m can be refined to 1.72 m or 1.725 m — and the figure still makes sense.
Characteristics of Continuous Data
- It is measurable rather than countable.
- It can take any value in a range and may include decimals.
- It can change continuously, taking different values at different points in time.
- It is best displayed using histograms and line graphs.
Continuous data is often discussed alongside the levels of measurement, where two related scales appear — interval and ratio:
Interval Data
Interval data is measured on a scale with equal, ordered intervals but no true zero. Values can be added and subtracted, but ratios are not meaningful. Temperature in degrees Celsius is the standard example: the difference between 10°C and 20°C equals the difference between 20°C and 30°C, but 0°C does not mean “no temperature,” and 20°C is not “twice as hot” as 10°C. Dates and clock times are also interval data — the gaps between values are equal, but the zero point is arbitrary.
Ratio Data
Ratio data has all the properties of interval data plus a true zero, where zero genuinely means “none.” Because of this, ratios are meaningful and values can be multiplied and divided. For example, the speed of a car can be 0, 5, 15 or 25 mph: 0 mph really does mean the car is at rest, and 20 mph is genuinely twice as fast as 10 mph. Weight, height, distance and age are other examples of ratio data.
Stuck analysing your numerical data?
ResearchProspect to the rescue!
Our experts can clean, analyse and interpret your discrete and continuous data with our statistical analysis service.


