Upload your assignment, essay, research paper, or dissertation draft and our academic experts will review it and provide structured feedback within 24–48 hours.
Here is a sample that showcases why we are one of the world’s leading academic writing firms. This assignment was created by one of our expert academic writers and demonstrated the highest academic quality. Place your order today to achieve academic greatness.
The current report quantitatively analyzes three variables – load factors, revenue passenger mile, and available seat miles between American Airlines and U.S. major carriers (cumulatively).
The data retrieved for the analysis was extracted from the Bureau of Transportation Statistics, focusing on domestic flights from January 2006 to December 2012.
The quantitative analysis focused on finding critical statistical values like mean, median, mode, standard deviation, variance, and minimum/maximum variables.
These values were calculated in Microsoft Excel 2013 to compare American Airlines’ performance to the entire domestic industry. The comparison was completed using summary statistics and scatter plots of the information that are further presented below.
Summary Statistics
Below are summary statistics for each data set, which had eighty-four (84) values in the entire sample. The arithmetic mean was calculated using the following formula; x_bar= (Σxi)/n. All major U.S. carriers had a load factor mean of 81% (see Table 1), while American Airlines had 82.934% (see Table 2).
Passenger load factor is used to measure airlines’ capacity utilization, often used to examine the effectiveness of airline carriers to fill up their seats and generate fare revenue (GAIP, 2017b). Based on the average obtained, American Airlines has a higher load factor that is above the industry mean.
The measures of central tendency – mode and median are also close to the average for all major US carriers as they both equal 81.43%. At the same time, American Airlines has a median and mode of 83.355% and 84.56%, respectively. Again performing above the industry average. However, this may indicate that American Airlines is creeping closer to crush loading, which is witnessed on various country flights (GAIP, 2017a).
Table 1- Summary Statistics of All Major U.S. Carriers (Domestic)
Load Factors
Revenue Passenger Miles
Available Seat Miles
Mean
81
Mean
48,629,156
Mean
58,077,063
Median
81.43
Median
47,904,518
Median
58,227,952
Mode
81.4381.43
Mode
NONE
Mode
NONE
Minimum
72.29
Minimum
36,997,641
Minimum
47,817,552
Maximum
87.15
Maximum
62,915,780
Maximum
65,566,709
Standard Dev
3.9091975
Standard Dev
5,477,877
Standard Dev
3,929,729
Variance Dev
15.281825
Variance Dev
30,007,131,936,823
Variance Dev
15,442,771,170,173
Table 2- Summary Statistics of American Airlines (Domestic)
On the other hand, revenue passenger mile measures traffic for an airline and is considered the necessary amount of production that an airline carrier can create (GAIP, 2017b). The averages in both tables above cumulative major airliners produced the most revenue passenger miles with USD 48 million while American Airlines produced 6.7 million USD.
Lastly, available seat miles are a measurement of airlines’ flight passenger capacity. Cumulatively, the industry holds 58miilion of these seats while American Airlines has about 8 million in available seat miles. Once again, those in the cumulative industry are outperforming American Airlines domestically.
The measurements – variance is used in a data set to measure how far apart they are or how each of the numbers pulled is considered the set or the mean. This means that variance can be used to see how individual numbers may relate to each other within a data set instead of arranging the data in quartiles.
The variance of cumulative data and American airlines of load factors is approximately the same, estimated to be about 15% and 16%, respectively. There is not much difference in the variance between American Airlines and all other significant carriers flying domestically based on load factor.
However, variance differs significantly between the two when it comes to revenue passenger miles. Overall, the cumulative industry outperforms American Airlines in all variables, although American Airlines has a more significant load factor.
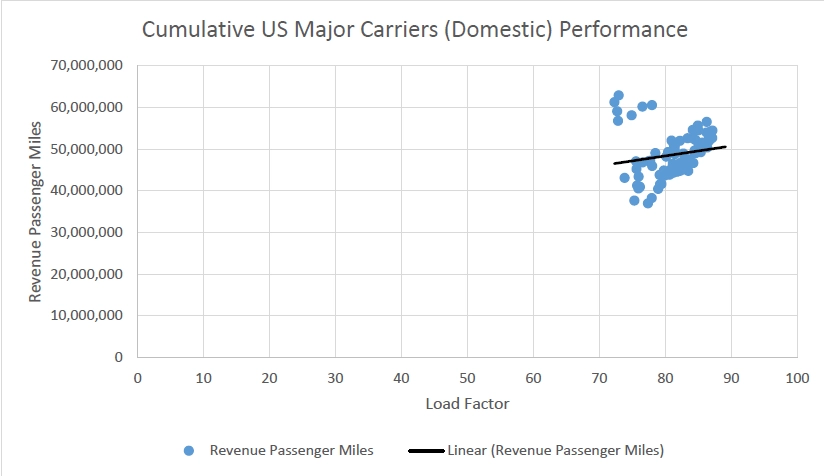
Figure 1- Cumulative US Major Carriers (Domestic) Performance
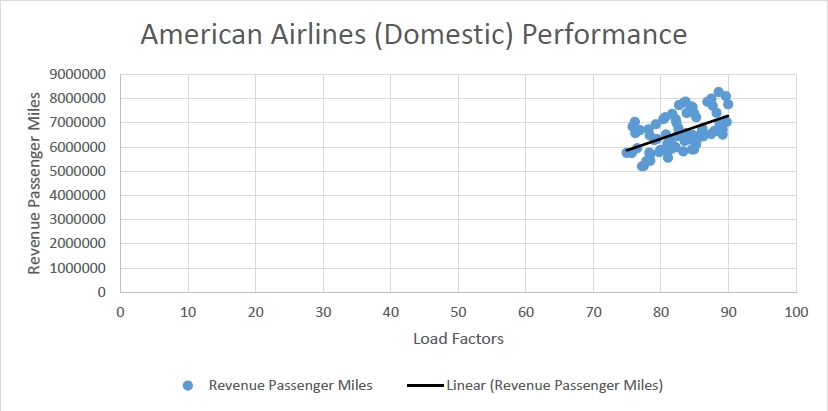
Scatter plots were made to analyse the two variables of significance better: load factor and revenue passenger miles, and illustrate the relationship between the two variables in the figures below. Both figures produce a positive correlation between the two variables. This suggests that both variables are moving in tandem with increasing load factor resulting in increasing revenue passenger miles. However, Fig.1 also presents a few outliers in the data, which do not follow the positive trend. The data does not provide a reason for this, but it can be interpreted that specific carriers may not perform in tandem with the other carriers. On the other hand, American Airlines (see Fig.2) shows uniformity in correlation with a steep upward rising gradient and represents a positive correlation between the two values.
Figure 2- American Airlines (Domestic) Performance
Global Airline Industry Program (GAIP). (2017a). Traffic and capacity by operating region. Retrieved from http://web.mit.edu/airlinedata/www/Traffic&Capacity.html, on July 5th, 2017. Global Airline Industry Program (GAIP). (2017b). Glossary. Retrieved from http://web.mit.edu/airlinedata/www/Res_Glossary.html, on July 5th, 2017.