Here is a sample that showcases why we are one of the world’s leading academic writing firms. This assignment was created by one of our expert academic writers and demonstrated the highest academic quality. Place your order today to achieve academic greatness.
Investment choices need to be made with caution keeping in mind the various financial events that had taken place resulting in the worldwide recession since 2009. It is important to take into consideration various factors of a business before attempting to invest in it. For the current report, two potential companies; Wallace and Gromit are being analyzed for investors to determine which of the two would be the better investment.
In order to analyze the companies it was essential to conduct calculations on various financial
ratios. For the current study, the following ratios were calculated;
Using these ratios, a report was prepared for investors examining both company’s performance and position to one another. The report also details various other factors that need to be taken into consideration before investing. Also, rumor’s of Gromit’s expansion plan were analyzed in order to develop strategies that will help Gromit to finance the expansion of their production facilities.
| Wallace | Gromit |
|---|---|
| Current Ratio = Current Assets/Current Liabilities | Current Ratio = Current Assets/Current Liabilities |
| Current Ratio = 303/70 | Current Ratio = 274/151 |
| Current Ratio = 4.32 | Current Ratio = 1.81 |
| Wallace | Gromit |
| Quick Ratio = Current Assets – Inventories/Current Liabilities | Quick Ratio = Current Assets – Inventories/Current Liabilities |
| Quick Ratio = 303 – 138/70 | Quick Ratio = 271 – 167/151 |
| Quick Ratio = 2.36 | Quick Ratio = 0.69 |
| Wallace | Gromit |
| RCP = Average Accounts Receivable/Annual Sales ÷ 354 Days | RCP = Average Accounts Receivable/Annual Sales ÷ 354 Days |
| RCP = 69000/596000 ÷ 365 | RCP = 98000/678000 ÷ 365 |
| RCP = 42.3 Days | RCP = 52.6 Days |
It should be note that Capital Employed as indicated in the denominator of the formula is the sum of shareholders’ equity and debt liabilities. This can be simplified as being
| Wallace | Gromit |
| Capital Employed = Total Assets – Current liabilities | Capital Employed = Total Assets – Current liabilities |
| Capital Employed = 610 – 70 | Capital Employed = 1,200 – 151 |
| Capital Employed = 540 | Capital Employed = 1049 |
| Return on Capital Employed (ROCE) = Earning Before Interest and Tax/Capital Employed | Return on Capital Employed (ROCE) = Earning Before Interest and Tax/Capital Employed |
| Return on Capital Employed (ROCE) = 113/540 | Return on Capital Employed (ROCE) = 43/1049 |
| Return on Capital Employed (ROCE) = 0.21 | Return on Capital Employed (ROCE) = 0.04 |
| Wallace | Gromit |
| Gross Profit Margin = Net Sales – Cost of Goods Sold/Net Sales × 100% | Gross Profit Margin = Net Sales – Cost of Goods Sold/Net Sales × 100% |
| Gross Profit Margin = 596 – 394/596 × 100% | Gross Profit Margin = 678 – 526/678 × 100% |
| Gross Profit Margin = 33.89% | Gross Profit Margin = 22.42% |
| Wallace | Gromit |
| Net Profit Margin = Net Income (Profit for the Year)/Net Sales × 100% | Net Profit Margin = Net Income (Profit for the Year)/Net Sales × 100% |
| Net Profit Margin = 99/586 × 100% | Net Profit Margin = 24/678 × 100% |
| Net Profit Margin = 16.89% | Net Profit Margin = 3.54% |
Orders completed by our expert writers are
Financial ratios are an imperative tool that is used by analysts to assess the performance and position of companies. Using these tools, analysts can compare companies to one another when they are sharing an industry. The table below outlines the results for both companies in terms of
their financial standing based on the ratio calculations.
Friesen and Swift (2009) argues that the current ratio is popular with financial analysts as it is used to test the liquidity of the company to derive a portion of the current assets available to cover up the company’s current liabilities. The concept behind the use of this ration is to examine if the
company is able to readily use their short-term assets to pay off their short-term liabilities.
Irons (2009) asserts that from a theoretical point of view, the higher the current ratio the more likely is the company to pay off their short-term liabilities. Based on this perception alone, it is obvious that Wallace is the better company in this aspect than compared to competitors, Gromit. However, contrary to this perception,
Moles et al. (2013) argue that the current ratio is flawed as an indicator for liquidity as it is based on the premise of liquidation of the all of the company’s current assets in order to meet with its liabilities. Moles et al. (2013) goes on to argue that in reality that is not the case. In order to understand the company’s real liquidity status, it is imperative to analyze the current assets that are using the cash conversion cycle.
Another liquidity ratio, the quick ratio; measures the ability to the company to pay its current liabilities when needed using only quick assets or current assets that are converted to cash within 90 days or short term in general.
According to Friesen and Swift (2009) quick ratios are the dollar amount of a liquid asset that is available for each of the dollar current liabilities. Moles et al. (2013) argues that higher the quick ratio that better the liquidity position of the company. Again, Wallace performs better than Gromit as they produced a quick ratio of 2.36 meaning the company has £2.36 of liquid assets available to cover each £1.00 current liabilities.
| Wallace | Gromit | |
| Current Ratio | 4.32 | 1.81 |
| Quick Ratio | 2.36 | 0.69 |
| Receivables collection period | ||
| ROCE | 0.21 | 0.04 |
| Gross Profit Margin % | 33.89% | 22.24% |
| Net Profit % | 16.89% | 3.54% |
Other ratios such as the ROCE indicate the company’s effective use of capital to generate shareholder value. It’s a useful metric to compare the profitability of companies based on the amount of capital they are able to use. Based on this metric alone, it is obvious that Wallace has
once again outshined its competitor Gromit.
Wallace does a better job at employing its capital as they have a greater amount of profit before tax with a lesser amount of capital employed than compared to Gromit who employ a greater amount of capital but don’t gain any outstanding returns.
Wallace’s performance outshines Gromit on the other profitability ratios of gross profit margin % which measures the company’s ability to retain every pound amount of revenues after paying cost of goods sold. Net profit margin, is a metric that measures the company’s ability to
translate monies earned into profits.
Lewis and Einhorn (2009) argues that companies that are able to expand their net margins over a gradual period of time are generally rewarded with share price growth since it is able to lead directly to higher levels of profitability.
Financial analysis of both companies lead to the conclusion that of the both, Wallace is a better investment because it is financially healthy compared to its competitor. Wallace also seems to be a safer investment with a chance of gaining higher profits for investment than compared to Gromit.
The financial health of a company is just a small factor to consider when making an investment. There are many other factors and details that need to be taken into consideration. The Great Recession of 2008 was a blow back to the global economy with various causes, one of the most
cited being the nature of excessive risk taking behavior during that time from investors and financial institutions.
Lewis and Einhorn (2009) opinionated that the sellers of risk need to have the capital that supports their bets. This means that a stable financial system needs to have firms who are able to maintain financial capacity to support the profit return commitments that they make.
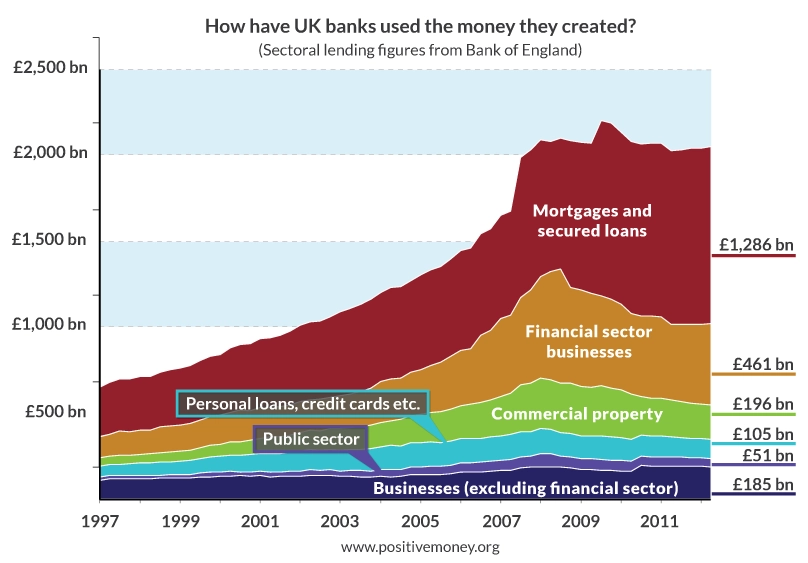
Former chairman of UK’s Financial Services Authority is noted of saying, “The financial crisis of 2007 to 2008 occurred because we failed to constrain the financial system’s creation of private credit and money.” According to the figure (See Appendix B), 32 per cent of the money created
during 2000-2007 was injected into the financial markets that went on later to implode during the start of the financial crisis.
According to Irons (2009) non-residential investment has decreased by 20 per cent from its peak levels in the second quarter of 2009 due to the reduction in investment.
As an investor it is important to acknowledge the financial environment and global events in order to make smart investments although their maybe a greater chance of risk. Therefore, as an investor is it essential to take into consider the following factors in order to avoid repeating the mistakes of 2000-2007.
1 Evaluation of comfort in taking risks- Although all investments have some degree of risk, it is essential to calculate this risk if you are investing in securities such as stocks, bonds, or mutual funds. When taking this risk it is essential to take into consideration historical trends of the company, their products, current top level executives, customers, and inflation risk.
2 Per Unit Economics- As an investor it is essential to take into consideration the amount of money earned by the company on each unit of sale of their product. Many companies attract investors although they lose money on each unit that is sold.
3 Understand the Business- Peter Lynch stated, “Invest in what you know”, before investing in a company it is essential that an investor uses the product and studies the business.
4 Understand the exit strategy- As an investor it is essential to know the exit scenarios in the industry that is invested in. These are some of the important components that need to be considered before divulging into an investment.
Gromit is planning on expanding the business by setting up production units that will cost £2.5 million. Based on Gromit’s current financial position, expansion at this time may not be a viable strategy. However, it is essential that Gromit reviews its options for financing in order to make the expansion successful.
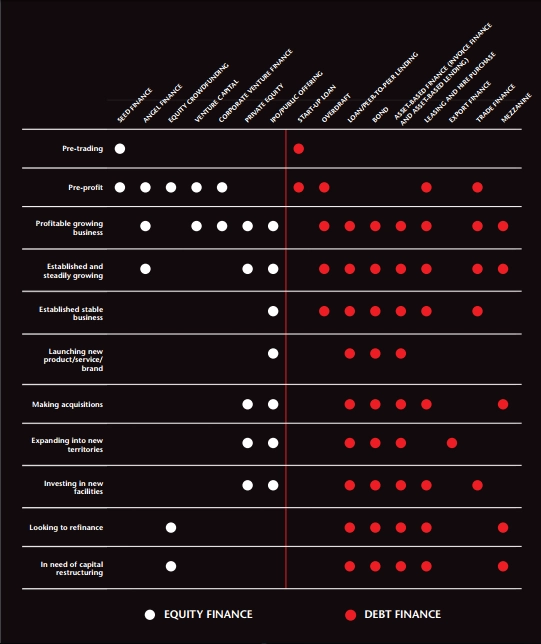
Corporate Finance Faculty and British Business Bank (2014) devised a set of options (See Appendix A) that can be used to aid in making financing decisions based on the milestone the business is experiencing.
The following are the options available for Gromit based on equity and debt finance.
| Equity Finance | Debt Finance |
| Private Equity | Loan/Peer-to-Peer lending |
| IPO/Public Offering | Bond |
| Invoice Finance/Asset Based Lending | |
| Trade Finance |
Debt financing involves the borrowing of funds that will be repaid later with interest. On the other hand, equity financing involves raising money by selling interests in the company. Private equity is equity capital that is not quoted on a public exchanges.
It consists of investors and funds that are able to make direct investments into private companies. Private equity is often used for distressed companies or a liquidation event and therefore requires long holding periods.
This option will provide the largest sums of money to the company and according to Boston Consulting Group (2014) more than 2/3 of private equity deals produced 20 per cent growth in a company’s annual profits.
One of the biggest drawback that needs to be considered is there will be a demand for majority stake which means releasing ownership stake. In addition, private equity firms will want to be actively involved in management of the company which will mean that owners of Gromit will lose basic elements of business such as hiring, development of business strategy and choosing the management team.
Another possible route for Gromit may be to begin issuing bonds. Compared to other forms of financing, bonds can be a better option for a company. For example, in comparison to selling assets, bonds can be a better decision as a company maybe in the process of growing and needs to retain assets.
In down markets many companies become reluctant to selling their assets due to the small chance of finding a buyer that is willing to pay an acceptable price. Also, issuing bonds is cheaper for a company than issuing shares. It is obvious that issuing bonds is a form of borrowing money and it does have higher risks to its alternatives.
The biggest risk a company runs is borrowing too much money coupled with unpredictable events that result in the borrower unable to return its lenders. Bonds also carry with the risks of call and prepayment, credit risk, liquidity risk, event risk, exchange rate risk, inflation risk, sovereign risk, yield curve risk, reinvestment risk, and volatility risk (CFF & BBB 2014).
It is possible for Gromit to also opt for invoice financing, in which a third party agrees to buy the company’s unpaid invoices for a specific fee. However, this choice results in loss of profit and influence the company’s ability to get alternative funding as they will not have book debts as
security.
Corporate Finance Faculty & British Business Bank. (2014) The Business Finance Guide. [online]
Available from < https://www.betterbusinessfinance.co.uk/images/pdfs/the-business-financeguide.pdf>. [Accessed: 19th April 2016].
Friesen, G. C., and Swift, C. (2009) Overreaction in the thrift of IPO aftermath. Journal of Banking
& Finance, 33(7), pp. 1285-1298.
Irons, J. (2009) Economic scarring. Economic Policy Institute, Briefing Paper 243.
Lewis, M., and Einhorn, D. (2009) How to repair a broken financial world. The New York Times.[online]
Available from <http://www.nytimes.com/2009/01/04/opinion/04lewiseinhornb.html?_r=0>. [Accessed: 18 April
2016
Moles, P., Parrino, R., and Kidwell, D. (2013) Corporate Finance. Edinburg, Scotlan: Edinburgh
Napler University.
To write an undergraduate academic report:

All work is written by human writers. 100% AI free, guaranteed.

100% money back guarantee if you find plagiarism in our work.
COMPANY DETAILS


