Here is a sample that showcases why we are one of the world’s leading academic writing firms. This assignment was created by one of our expert academic writers and demonstrated the highest academic quality. Place your order today to achieve academic greatness.
Abstract: This report entails some of the highlighted non-destructive testing methods and monitoring for the construction material. The initial part starts with the introduction of methodologies used in the lab tests, further led by its significance. The methodology of the tests and procedures are discussed, followed by results and discussion. An analytical analysis of the tests is a part of the report.
This report is primarily about the lab tests performed to analyse the strength of concrete material. Two properties of concrete are being tested, which are strength and durability. There are various tests and methods available to evaluate the strength and durability of the concrete material. Semi destructive and non-destructive analyses are studied for the assessment of the strength and durability of concrete material.
However, concrete has high compressive strength and relatively low tensile strength. But the testing of material for its strength is the exact measure of its property. The coefficient of thermal expansion is very low for the concrete material. Destructive and non-destructive testing has been widely used for the assessment of materials in the construction industry.
Specimen performance measures material behaviour under various loads, and it can be analyzed through Destructive Physical Analysis (DPA). Nondestructive testing (NDT) or Non-destructive inspection (NDI) is a range of analysis used in the technology industry to assess the material’s properties.
Although destructive testing is easy to carry out and yields most of the required information, non-destructive testing is used to test properties, materials, systems, or components without causing damage to the material. For a long time, identification of embedded flaws or structural failures has been carried out through costly and time-consuming methods, e.g. open up tests or laboratory tests on core samples.
Non-destructive testing provides immediate results and provides reliable data for repair and subsequence maintenance of buildings and structural elements. Some of the in-situ concrete strength tests are rebound hammer test, pull-out test including LOK and CAPO test, ultrasonic pulse velocity test, bored pile proofing test, external wall – rapid infrared thermographic survey (RITS), and plate load test.
For concrete strength, this study relies on the results of the Lok test, rebound hammer test and ultrasonic pulse velocity test. Durability testing of concrete deployed cover meter inspection, half-cell potential test and carbonation test.
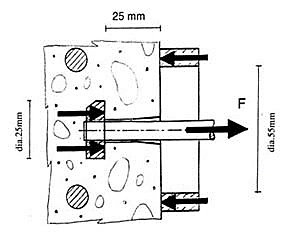
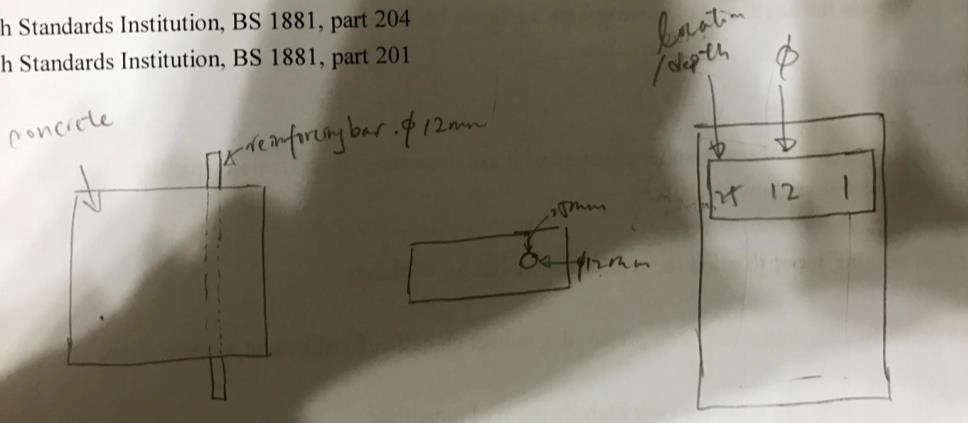
In the pull-out test, a special tension arm is used to measure the force required to pull-out a steel rod, previously cast-in, with an embedded enlarged terminal. A cone of concrete is pulled out in this process, and the required force is the measure of the compressive strength of the material, as shown in figure 1.’
This non-destructive test is used to monitor and record the gauge reading from the LoK test, which was further compared with the results obtained by other groups. The obtained results were further used to find the equivalent cube strength by using the calibrated chart. The results of the experiment (BS 1881-207:1992, clause 7, Pull-out test) are given in (Test 01 for group ‘A’ & Test 02 for group ‘B’) in the table below;
Size of concrete cube = 200mm*200mm*200mm
Table -1 results of LOK test Place Table Here
| Data Sheet | Operator: George Yeung | |||||
|---|---|---|---|---|---|---|
| Group: B | ||||||
| Date of commencement: 24/3/2017 | ||||||
| Test 02 | ||||||
| Sample Concrete | Cement | Fine Aggregate | Sand | Water | Total | |
| materials (kg) | 7.34 | 26.01 | 16.32 | 3.3 | 52.97 | |
| mixing ratio: |
||||||
| Date/Time concreting | Pulling point no. | Date/Time LOK Test | Pull-out force (kN) | Ref. Cube no. | Date/Time Cube test | Ref. Cube Strength(MPa) |
| Mixing: 24/3 | 1 | 31/3 | 25 | 1 | 31/3 | 32.5 |
| Casting: 7 days 2 | 2 | 31/3 | 23 | 2 | 31/3 | 29 |
| Finish: 31/3 | 3 | N/A | ||||
| 4 | N/A | |||||
Orders completed by our expert writers are

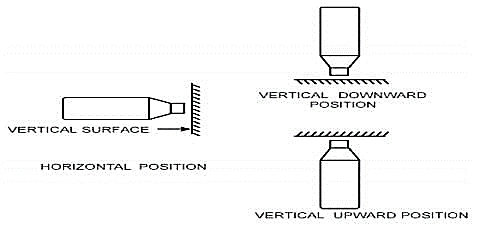
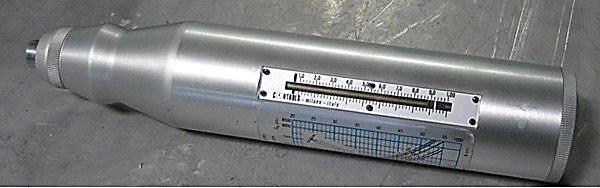
The basic working principle of the rebound hammer test is how much elastic mass bounces back on the hardness of the surface against which the mass impinges.
The results of this test are given the table below;
Table -2 results of rebound hammer test
| Test 01 | |
|---|---|
| Direction of hammer: | Downward |
Horizontal |
|
| Downward | |
| Point No. | Rebound value |
| 1 | 32 |
| 2 | 25 |
| 3 | 26 |
| 4 | 26 |
| 5 | 23 |
| 6 | 24 |
| 7 | 28 |
| 8 | 26 |
| 9 | 20 |
| 10 | 28 |
| 11 | 25 |
| 12 | 21 |
| Mean value: 25.333 | |
| Strength: 0.6333 | N/mm2 |
In this method, the wave velocity is evaluated from the time a pulse takes to travel a measured distance. This ultrasonic pulse is obtained by applying a rapid change of potential from a transmitter driver to a piezo-electric crystal transducer, which is emitting vibrations at its fundamental frequency. In principle, the lowering of concrete density caused by an increase in the water/cement ratio decreases both the compressive strength of the concrete and the velocity of a pulse transmitted through it.
The pulse velocity ‘ v ‘ (in km/s or m/s) is given by
v = L/T
where
L _ is the path length (km);
T _ is the time taken by the pulse to traverse that length (sec.).
The results of this experiment are as given in the table below;
Cube Size: 150mm*150mm*150mm
Table -3 results of UPV test
| Test 01 : Air | Test 02 : Brick | Test 03 : Concrete |
|---|---|---|
| L= 0.2m | L= 0.2m | L= 0.2m |
| T= 1.33*10^-3s | T= 6.515*10^-5s | T= 4.695*10^-5s |
| v= 1500m/s | v= 3070m/s | v= 4260m/s |
Measurement of reinforcement cover depth and determination of location is based upon the disturbance, which is caused by the embedded metal to an electromagnetic field generated by a handheld search head.
The formation of a corrosion cell between a metallic element and its environment is dependent upon the creation of electrons from the metal during the reduction reaction at the anode. This manifestation will be shown by the presence of a potential between the metal and a datum point on the material.
The apparatus will usually consist of a half-cell containing copper/copper sulphate or silver/silver chloride solution. The cell is brought into contact with the concrete slab via a porous plug. The cell is connected to a high impedance voltmeter; the voltmeter is then in turn connected via a cable and crocodile clip to the reinforcement bar.
Test outcomes produce a scaled map of equal potential. The experimentation used an appropriate contour interval assuming an initial basis of 10mV. Using the contour information attempt to arrive at a correlation between corrosion activity (or inactivity) and chloride content.
CO2 present in the atmosphere reacts, in the presence of moisture, with hydrated cement minerals. The action of CO2 takes place even at small concentrations such as present in rural air, where the CO2 content is about 0.03% by volume. The rate of carbonation increases with an increase in the concentration of CO2, especially at high water/cement ratios. Ca(OH)2 carbonates to CaCO3.
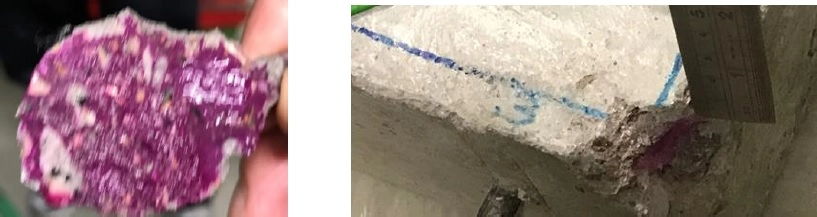
Table 1 gives a brief review of experimental details which shows the test performed for the 7.34 kgs of cement with a mixture of sand and water. The mixing ratio was kept 1:2:3 for the experiment.
An appropriate mixing ratio has been selected out of a few suggested ratios in the previous studies. The LOK gives 32.5 MPa of strength for concrete material with a pull-out force of 25 kN and 29 MPa strength with 23 kN pull-out force.
The LOK test has below-mentioned mapping with cube strength and LOK strength as variables. Cube strength is measured in mega Pascal and LOK strength in kilonewton. LOK uses 25mm diameter insert cast into the concrete at depth of 25mm. a hand-operated jack is used with a 55mm reaction ring and an average of 6 readings used for correlation purpose; typical CoV of the test is 7%.
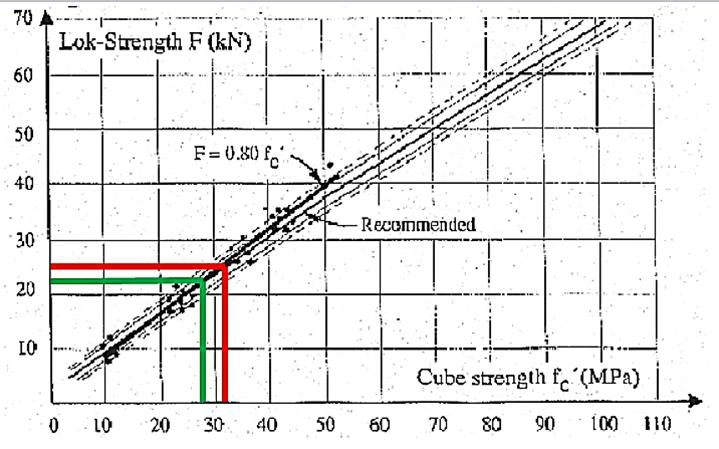
Figure 5 shows an accurate estimate of in-place strength because the peak pull-out force has a well-defined correlation to compressive strength measured using standard cylinders or cubes. One general correlation is applicable for all normal density concrete mixtures, as shown below.
At the 65 % confidence level and for an average of 5 tests, the estimated compressive strength based on the LOK-TEST and the general correlations indicated above is within ± 6 % of the strength measured from tests of the standard specimen (cylinders or cubes) for the maximum aggregate size of 38mm. The coefficient of variation of individual LOK-TEST results is about ±8 % for normal density concrete.
The test program produced a plot of LOK test data against cube values observed over a 7 day period. Since the data was bunched, the mean value and the standard deviation on that data is used for the calculations in figure 5. Time-dependent data wasn’t viable since dry-cured specimens complete a significant part of hydration in a relatively short period of time.
Results of the rebound hammer test are given in the following table in figure 6. It is preferable to draw a regular grid of lines 20mm to 50mm apart and to take the intersections of the lines as test points. The table of test points (T-tests) is given in Table in figure 6.
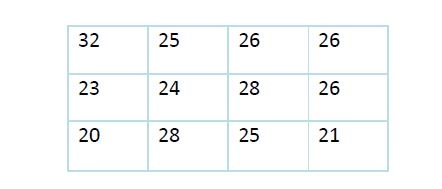
Figure 6: Grid obtained from the results of Hammer test
Following steps have been carried out to evaluate the observations and results of the rebound hammer test
1. Comparing the rebound number between two sample variations
2. Plotting actual compressive strength versus rebound number
3. Comparing average actual compressive strength versus average estimated strength from Rebound Hammer
According to table 2, the direction of the hammer in the rebound hammer test is kept downwards. Rebound values have been calculated at 12 points on the concrete material for its strength which gives a mean rebound value of 25.333. The output of the test is the strength of the material which is 0.6333 N/mm2.
Recommended formulas and correlation coefficients remained reliable for narrow limits on factors like composition, concrete age, moisture content, etc. Despite the high uncertainty of the raw data, the methodology persisted for use in the evaluation of the strength of concrete.
With uncontrolled parameters like environmental factors, age, the compressive strength of concrete, the rebound hammer test results showed very little correlation with concrete core test results even for the statistically large data set.
The results of ultrasonic velocity tests are evaluated as mentioned in the Figure below. UPV test is sensitive tools to help to evaluate variations occurring in the homogeneity of the concrete material. The following graph is thus drawn between the pulse velocity and compressive strength. Pulse velocity of the sent ray indicates that how much distance it travels and relatively is the measure of the strength of concrete.
The graph indicates five different plots for five different proportions of the concrete mixture. Fourth line with the mixture proportion 1:2.5:5 gives the maximum endurance of concrete material and is shown in the red colour. Table 3 provides a data taken from the experiment of UPV test with air interference.

Where Cube Size: 150mm*150mm*150mm
Cube 1: 523.76kN > Compress Strength= 523.76 *1000/150*150=23.278MPa
Cube 2: 496.80kN > Compress Strength= 496.80 *1000/150*150=22.080MPa
Some of the specimen details are necessary to discuss in the results. For the experimental study, 10 concrete blocks were cast with high strength concrete. The 7 days cube strength of concrete was 28.3 MPa. The size of all the concrete blocks is 200 × 200 × 50 mm. Steel strengthening bars of five of the frequently available bar diameters were chosen in such a way they cover the wide range bars that are normally used in residential structures.
Bars of diameter 22mm, 15mm, 10mm, 12mm, and 9mm have been preferred for casting the blocks. Each block of concrete was cast with only one bar, the centre of which was placed either at 25mm or 50mm from the top, for the full width of the specimen. To place the bars in a constant position during concreting and vibrating, moulds were made with a hole on either side.
The holes were made with their centres at 25mm or 50mm from the surface. Separate moulds were cast for each of the ten specimens. Figure 7 gives a brief of specimens and the durability inspection trough covermeter test.
The data shows the stability of correlation between LOK pull out and the compressive test doesn’t vary or get affected with the type of cement used, age, air interference, admixtures, curing conditions, and size of aggregates up to 40 mm maximum aggregate size.
Available on request!
To write a master’s level academic report:

All work is written by human writers. 100% AI free, guaranteed.

100% money back guarantee if you find plagiarism in our work.
COMPANY DETAILS


