Here is a sample that showcases why we are one of the world’s leading academic writing firms. This assignment was created by one of our expert academic writers and demonstrated the highest academic quality. Place your order today to achieve academic greatness.
The chapter presents the findings of the study. The questionnaire acquired the data (see Appendix A) and analyzed using IBM SPSS v. 24. The data was analyzed for descriptive, Cronbach’s alpha, and regression analysis. The frequency statistics were acquired for the demographic breakdown of the sample. As mentioned earlier, the data was collected through random sampling by placing the survey on the Internet using Survey Monkey.
The primary issue with this was that there is no specific population representation, and the population being questions is unknown. As with all surveys, there are chances of respondent bias, resulting in the interaction between variables and outliers in the data. The first section of the chapter describes the demographics, followed by a frequency analysis of section II questions, Cronbach’s alpha, and regression analysis.
The proposed sample designated for the current study was 300. The survey was posted on the Internet for seventy days to allow the maximum number of respondents to answer them.
However, a total of 243 completed surveys were received within the seventh-day period. Only surveys that were filled were included in the data analysis. Based on the surveys’ demographic analysis, a total of 107 males participated while 136 females participated.
Table 4.2-1: Respondent Gender and Ethnicity
| Ethnicity | |||||||
| African | Asian | Caucasian | Hispanic | Other | Total | ||
| Gender | Male | 19 | 22 | 15 | 32 | 19 | 107 |
| female | 32 | 31 | 33 | 39 | 1 | 136 | |
| total | 51 | 53 | 48 | 71 | 20 | 243 | |
Table. 4.2-1 illustrates the respondents’ ethnicity; from the data obtained, 71 Hispanics had participated in the survey, making them the largest group examined in terms of ethnicity compared to other ethnicities. The smallest group present in respondents identified as Caucasians, with only 15 participants present in the sample. Other characteristics of the respondents in the current study are present in Table 4.2-2 below.
Table 4.2-2: Demographic Characteristics of Respondents
| Gender | ||||
|---|---|---|---|---|
| Male | Female | Total | ||
| Age Group | 18-25 | 26 | 22 | 48 |
| 25-40 | 35 | 68 | 103 | |
| 40-55 | 25 | 31 | 56 | |
| Above 55 Years Old | 21 | 15 | 36 | |
| Education | Primary Education | 18 | 21 | 39 |
| CGSE/O-levels | 16 | 23 | 39 | |
| CGE/A-levels | 19 | 23 | 42 | |
| Bachelors | 38 | 60 | 98 | |
| Graduate | 9 | 6 | 15 | |
| Doctoral | 6 | 3 | 9 | |
| None | 1 | 0 | 1 | |
| Income | Less than 8,000 | 30 | 24 | 54 |
| 8,000-24,999 | 31 | 51 | 82 | |
| 25,000-40,999 | 29 | 40 | 69 | |
| 41,000-56,999 | 7 | 12 | 19 | |
| 57,000-72,999 | 4 | 3 | 7 | |
| 73,000 or more | 6 | 6 | 12 | |
| Working Hours | No | 34 | 37 | 71 |
| Part-Time | 33 | 53 | 86 | |
| Full Time | 40 | 46 | 86 | |
| Marital Status | Single/Never Married | 31 | 31 | 62 |
| Married/Living With Partner | 45 | 60 | 105 | |
| Separated/widowed/divorced | 31 | 45 | 76 | |
| Income | Less than 8,000 | 30 | 24 | 54 |
| 8,000-24,999 | 31 | 51 | 82 | |
| 25,000-40,999 | 29 | 40 | 69 | |
| 41,000-56,999 | 7 | 12 | 19 | |
| 57,000-72,999 | 4 | 3 | 7 | |
| 73,000 or more | 6 | 6 | 12 | |
Based on the table presented, 103 individuals made up the largest respondents based on age in the 24-40-year-old category. On the other hand, only 36 participants were representative of individuals above 55 years old. The median age for the participants was ages 25-40 years old. Of the sample, 98 participants held a Bachelors, and only one participant had no education. The median response for education was also bachelors, as present in Table 4.2-3.
Table 4.2-3: Frequency Analysis of Demographics
| Statistics | |||||||
|---|---|---|---|---|---|---|---|
| Age Group | Education | Working Hours | Marital Status | Ethnicity | Income | ||
| N | Valid | 243 | 243 | 243 | 243 | 243 | 243 |
| Missing | 0 | 0 | 0 | 0 | 0 | 0 | |
| Mean | 2.3292 | 3.1728 | 2.0617 | 2.0576 | 2.8189 | 2.5021 | |
| Median | 2.0000 | 4.0000 | 2.0000 | 2.0000 | 3.0000 | 2.0000 | |
| Mode | 2.00 | 4.00 | 2.00a | 2.00 | 4.00 | 2.00 | |
Based on the income, a majority of respondents (82) indicated that they earned £8,000 to £24,999 annually; while only seven indicated that income annually was £57,000-£72,999. The median response for annual income among respondents was £8,000- £24,999. An equal number of respondents indicated that they worked part-time and full time, split 86 participants indicating this.
However, only 71 respondents indicated that they did not work. Based on the frequency analysis, the median response was working full time. The marital status of 105 participants was either married or living with a partner, while only 76 were separated/widowed/divorce. The median answer of respondents was also married/living with a partner.
Orders completed by our expert writers are

Table 4.3-1 explains the descriptive statistics of brick and mortar stores, catalogue, and internet usage for finding information on products and purchasing products in the last three months. About 91% of participants indicated that they searched for product information in stores, followed by about 51% of searches using catalogues. Most participants indicated that they searched for information on the Internet, about 96%.
Table 4.3-1: Descriptive Statistics of Respondents Question 1&2 Section II
| Variables | Channel | Frequency | Percentage (%) |
|---|---|---|---|
| Searched for information in the last three months | Store | 223 | 91.77 |
| Catalog | 123 | 50.62 | |
| Internet | 233 | 95.88 | |
| Purchased products in the last three months | Store | 236 | 97.12 |
| Catalog | 111 | 45.68 | |
| Internet | 241 | 99.18 |
Also, participants indicated that 97% of them purchased products in the last three months from stores, while an estimate of 46% purchased from catalogues, and about 99% purchased online.
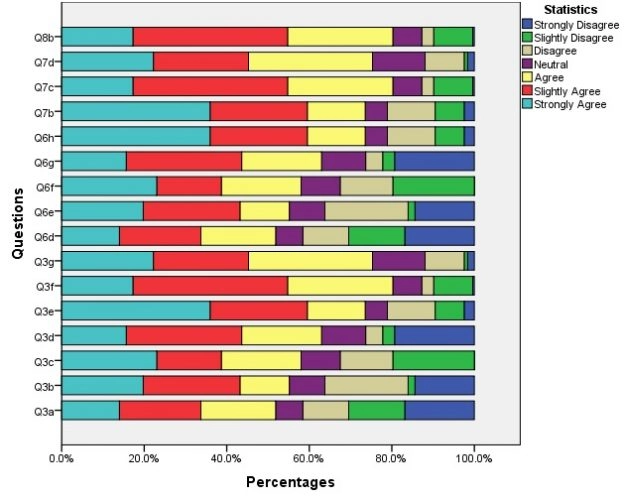
The questionnaire section II was designed using Likert-like questions that respondents were asked to answer using seven (7) point scale. Results of the questionnaire using cumulative percentage frequency are presented in Figs 4.3-1. below.
Fig. 4.3-1 presents the questionnaire results that analyzed hedonic and utilitarian beliefs; variables of self-efficacy, time, money, hedonic information products, utilitarian products; outcomes of self-efficacy; and behavioural intention. From the results is evident that 51.9% of respondents agreed to some degree that changing from the Internet to stores while shopping was fun. About 55% of respondents also agreed that changing from the Internet to stores when shopping was enjoyable.
For utilitarian beliefs present in question 3g, respondents presented a large majority with about 75% in some degree of agreement that chancing from the Internet to stores when shopping is efficient.
Questions 6d to 6h analyzed self-efficacy variables, time, money, information hedonic products, and utilitarian product. Based on the results presented in the figure below, 51.9% of respondents indicated some agreement level that they had the time to change between stores and the Internet.
Question 6f illustrates that about 58% of respondents agreed that they had the information needed to change between stores and the Internet to varying degrees. This supports the prediction made in hypothesis 5 that information will predict the perceived behavioural control when switching from the Internet to brick-and-mortar stores.
Reliability of items is necessary for evaluating assessments and questionnaires (Tavakol and Dennick 2011). It is often thought of as mandatory in research to estimate the quantity of alpha to increase the validity and accuracy of interpretations of results for a given data set. Academics such as Gliem and Gliem (2003) argue that it is important to calculate Cronbach’s alpha when using Likert-type scales used in the current study. Using SPSS, the following figure below presents the result for Cronbach alpha.
| Reliability Statistics | |
|---|---|
| Cronbach’s Alpha |
N of items |
| .924 | 42 |
Kline (2000); Georgy and Mallery (2003); and DeVeillis (2012) provide the following rules for identifying internal consistency; α ≥ 0.9 – excellent; 0.9 ≥ α ≥ 0.8- good; 0.8 ≥ α ≥ 0.7- acceptable; 0.7 ≥ α ≥ 0.6 questionable; 0.6 ≥ α ≥ 0.5- poor; and 0.5 ≥ α- unacceptable. The alpha produced for the current study is .924, making it reside in the excellent category.
Thus, it is concluded that the questionnaire produced with all its items holds a fair internal consistency making the items in the study’s questionnaire measured as one-dimensional. Other uninformed values of variables in the analysis produced closeness in the value of alpha presented in Appendix B. This proves that the study’s alpha is not deflated or inflated by external or internal factors.
The section discusses the regression analysis for channel switching behaviour from the Internet to brick-and-mortar stores. For the analysis, independent variables used to predict channel switching behaviour attitudes were hedonic and utilitarian beliefs toward the Internet to store behaviour, the dependent variable.
The R2 value presented in the analysis increase once new terms are introduced into the regression model. Meaning, the addition of variables like hedonic beliefs, utilitarian beliefs, time, self-efficacy, normative beliefs, hedonic & utilitarian products, money, and information. All of these were independent predictor variables that were hypothesized to influence channel switching behaviour.
Regression Analysis for Hedonic and Utilitarian Beliefs on Channel Switching:
| Variables | Parameter Estimates | Standard Error |
|---|---|---|
| Predictors of Hedonic and Utilitarian Values on Attitude | – | – |
| Intercept | 0.148** | 0.058 |
| Hedonic Beliefs | 0.064 | 0.021 |
| Utilitarian Beliefs | 0.385*** | 0.018 |
| Adjusted R2 F |
0.18 72.233*** |
– |
The significant predictor of the dependent variable was Utilitarian beliefs with a regression coefficient of 0.385 (p<.001) accompanied by an overall F value of 72.233 (p<.001) and an Adjusted R2 value of 0.18. Therefore, the results support hypothesis H2 that utilitarian beliefs will significantly predict switching between the Internet to brick and mortar stores.
Other variables such as self-efficacy, time, money, information, hedonic products, and utilitarian products were kept independent of predicting the participants’ perceived behavioural control (PBC).
Based on the results of the regression analysis majority of contributing factors the significantly predicted the dependent variable were self-efficacy with valued at 0.173 (p<.001) and information valued at 0.429 (p<.001), as seen in Table 4.3-3.
These values were accompanied by an overall F value of 72.724 (p<0.001) and an adjusted R2 value of 0.43. Using the stepwise regression analysis method for predicting perceived behavioural control (PBC) changed the value of adjusted R2 to 0.41 and increased F’s value to 152.148 (Table 4.3-3).
Significant predictors of PBC based on this method were self-efficacy with 0.179 (p<.001), information at 0.421 (p<.001), and Utilitarian products producing 0.184 (p<.05). Based on these results, hypotheses H3, H5, and H8 are supported. Self-efficacy, information, and utilitarian product will predict the perceived behavioural control when switching from the Internet to brick-and-mortar stores.
Furthermore, PBC was set as an independent variable to predict channel-switching behaviour. Table 4.3-4 illustrates that PBC significantly influences channel switching behaviour with 0.113 (p<.001) with an adjusted R2 of 0.05 and F of 34.245. This supports hypothesis H9. Variables of attitude and PBC were kept as independent variables for the dependent variable channel switching intention.
Table 4:3-4 illustrates attitude with 0.359 and PBC -0.092 with an adjusted R2 of 0.49 and F of 179.012. These results support hypothesis H10. Lastly, channel-switching intention significantly predicted channel switching behaviour with produced regression value of 0.276 (p<.001) with an adjusted R2 or 0.06 and F value of 37.454.
| Variables | ParameterEstimates | Standard Error | Variables | Parameter Estimates | Standard Error |
|---|---|---|---|---|---|
| Predictors of Self-Efficacy, Time, Money, information, Hedonic Products, and Utilitarian Products on Perceived Behavioral Control (Enter Method) | – | – | Predictors of Self-Efficacy, Time, Money, information, Hedonic Products, and Utilitarian Products on Perceived Behavioral Control (Enter Method) | – | – |
| Intercept | 0.435*** | 0.053 | Intercept | 0.584*** | 0.053 |
| Self-Efficacy | 0.173*** | 0.022 | Self-Efficacy | 0.179*** | 0.013 |
| Time | 0.001 | 0.018 | Information | 0.421*** | 0.016 |
| Money | -0.043 | 0.016 | Utilitarian Products | 0.184* | 0.011 |
| Information | 0.429*** | 0.023 | |||
| Hedonic Products | 0.068 | 0.024 | |||
| Utilitarian Products | 0.062 | 0.022 | |||
| Adjusted R2 F |
0.43 72.724*** |
Adjusted R2 F |
0.41 152.148*** |
||
| *p<.05; **p<.01; ***p<.001 |
Table 4.3-4: Regression Analysis of Channel Switching Behaviour
| Variables | Parameter Estimates | Standard Error | Variables | Parameter Estimates | Standard Error |
|---|---|---|---|---|---|
| Predictors of Perceived Behavioral Control on Channel-Switching Behavior | – | – | Predictors of Attitude and Perceived Behavioral Control on Channel-Switching Intention | – | – |
| Intercept | 1.298*** | 0.034 | Intercept | -0.162** | 0.053 |
| Perceived Behavioral Control | 0.113*** | 0.028 | Attitude | 0.359*** | 0.031 |
| Perceived Behavioral Control | -0.092** | 0.027 | |||
| Adjusted R2 F |
0.05 34.245*** |
Adjusted R2 F |
0.49 179.012*** |
| Variables | ParameterEstimates | Standard Error |
|---|---|---|
| Predictors of Channel-Switching Intention on Channel-Switching Behavior | – | – |
| Intercept | 1.419*** | 0.037 |
| Channel-Switching Intention | 0.276*** | 0.029 |
| Adjusted R2 F |
0.06 37.454*** |
|
| *p<.05; **p<.01; ***p<.001 |
Based on the study’s findings, variables of Utilitarian beliefs, self-efficacy, information, utilitarian products, and attitude are significantly contributing factors for prompting customers to switch from using the Internet as a purchasing and information searching channel to brick and mortar stores.
These factors are why customers are looking more towards brick-and-mortar stores than shopping online, forcing businesses to establish physical store locations to accommodate customers. The findings were analyzed using frequency analysis, Cronbach’s alpha analysis, and regression analysis.
To write the Results chapter of a dissertation:

All work is written by human writers. 100% AI free, guaranteed.

100% money back guarantee if you find plagiarism in our work.
COMPANY DETAILS


