Here is a sample that showcases why we are one of the world’s leading academic writing firms. This assignment was created by one of our expert academic writers and demonstrated the highest academic quality. Place your order today to achieve academic greatness.
The chapter presents the results of the current study by implementing the methodology discussed in the preceding chapter. The findings are organised and raised in the current branch by first examining the questionnaire’s demographic results and discussing the data’s internal consistency and the PLS SEM.
The data were analysed using these various techniques as described in chapter three. The current chapter aims to present the statistical analysis from the acquired data to develop premises later in the final chapter.
As discussed in the previous chapter, 100 participants were sought after for the current study based on the IT project managers’ population. Of the 100 questionnaires distributed by walk-ins, a total of 63 were returned to the researcher.
Upon scrubbing the questionnaires in the sample, only 45 questionnaires were included in the current study, while 18 were not included. The exclusion of 18 representatives from the study was because they had not appropriately filled out the entire questionnaire as swats of questions remained unanswered. The table below illustrates the number of returned and questionnaires using the comparison category of gender.
Table 4.1- Response Rates of Participants (Source; Questionnaire)
| Respondents | Issued | Returned | Percentage |
|---|---|---|---|
| Male | 50 | 36 | 72.00 |
| Female | 50 | 9 | 18.00 |
| Total | 100 | 45 | 45.00 |
The total response rate of the population used in the study is 45.00%, which is considered decent. In the current study’s sample, male respondents had a higher response rate of 72% than females, who had a response rate of 18.00%.
Each of the respondents was asked to present their characteristics that compose the current study’s demographic characteristics. Respondents were first asked to indicate their age group, whose data output is presented below;
Table 4.2- Participant Age and Gender
| 20-25 | 26-35 | 36-45 | 44-55 | Over 55 |
|---|---|---|---|---|
| 8 | 15 | 6 | 4 | 3 |
| 5 | 4 | 0 | 0 | 0 |
The table indicates that most male respondents are 26-35 years of age; 15 respondents indicated this. While eight respondents indicated that they were between the ages of 20 and 25, six indicated they are between the ages of 36 and 45, four indicated they are between the ages of 44 and 55, and three of the respondents in the make group indicated they are over the age of 55. In the female respondent group, five females indicated they are in the age ranges of 20 and 25, and four indicated they are between the ages of 26 and 35.
The table indicates that most male respondents are 26-35 years of age; 15 respondents indicated this. While eight respondents indicated that they were between the ages of 20 and 25, six indicated they are between the ages of 36 and 45, four indicated they are between the ages of 44 and 55, and three of the respondents in the make group indicated they are over the age of 55. In the female respondent group, five females indicated they are in the age ranges of 20 and 25, and four indicated they are between the ages of 26 and 35.
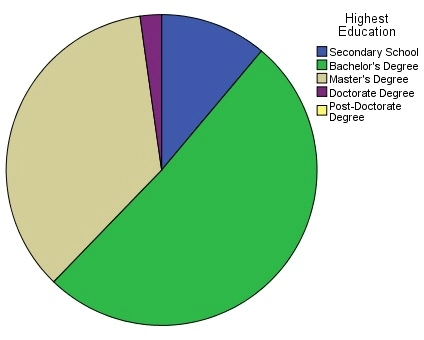
Figure 4.1- Respondent Education Output
Figure 4.1 illustrates the distribution of the highest possible education received by respondents in the current study. Of the sample obtained, 51.11% of respondents indicated that they received a Bachelor’s degree in their education form in their questionnaire. About 2.22 percent of the respondents said that their highest form of education was a Doctorate. In contrast, 11.11% of respondents indicated in the questionnaire that they achieved secondary schooling. Lastly, 35.56% of respondents in the sample stated that they had attained a Master’s degree, which indicates their highest form of education.
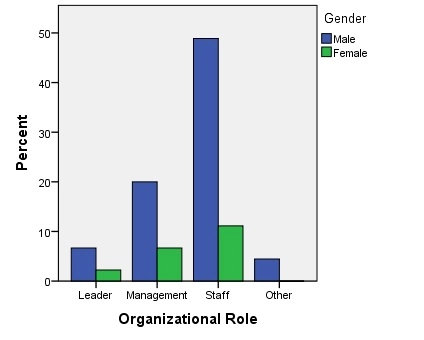
Figure 4.2- Participant responses to organisational role
The next portion of the questionnaire asked respondents to indicate their role in the organisation currently employed. The percentage of respondents’ roles was then analysed according to their gender. Figure 4.2 illustrates the distribution of organisational roles based on gender. As evident, the sample leaders are composed of 6.67% of males, while females only make up 2.22% of leaders in their respective organisations.
On the other hand, the role of management is again dominated by the male presence in which 20.00% of males having this role while only 6.67% of management is made of females.
As indicated in the sample, the designation of staff roles in organisations is also dominated by males, who make up 48.89% within their organisation. In comparison, females make up 11.11% of the staff in their organisations. Lastly, a few respondents, about 4.44%, indicated “other” as their role in the organisation, with only male respondents indicating this.
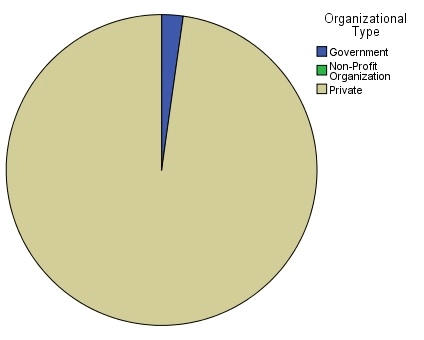
Respondents were also asked to indicate the type of organisation they worked for, choosing between government organisations, private and non-profit organisations. Figure 4.4 illustrates the responses of participants in the study. As seen in fig. 4.4 97.78% of the respondents in the current study indicated that they were employed in private organisations.
At the same time, 2.22% of respondents indicated that they worked under government organisations. There are no respondents in the current study that worked for non-profit organisations. In addition to the type of organisation, respondents were asked to indicate the size of the organisations that they worked for.
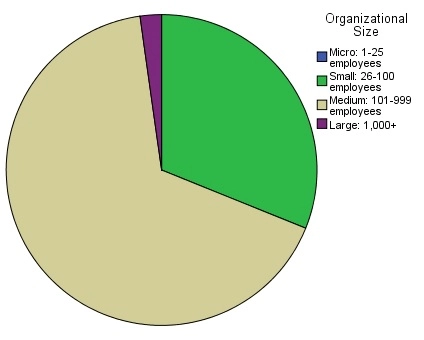
According to fig. 4.5 a majority of the sample respondents, about 66.67%, indicated that they worked for ‘medium-sized organisations that employed between 101 and 999 personnel. Furthermore, 31.11% of participants indicated that ‘small’ organisations employed them, with 26 to 200 personnel working for them. Lastly, 2.22% of participants from the sample indicated that they worked for ‘large’ organisations that employed 1,000 or more individuals.
Orders completed by our expert writers are
Cronbach’s alpha (α) was used as a measure to assess the reliability of the questionnaire’s scale items. The purpose of using Cronbach’s alpha was to measure the extent to which measures in the questionnaire are consistent in measuring its concepts. Each of the themes measured in the questionnaire included: organisational culture, national culture, interpersonal conflict, and project performance.
The resulting α coefficients fall between 0 and 1, which provides the overall assessment of the measure’s reliability. With high covariance among the items, α will begin to approach 1. The higher the α coefficient, the more it is concluded that the things have a shared covariance and most like measure the same underlying concept. The α calculated for each item in the questionnaire was separately tested for α coefficients using IBM SPSS v.24.
The reliability statistics produced for each item in the questionnaire are presented in table 4.3.
Table 4.3- Cronbach’s Alpha Results for Questionnaire
Reliability Statistics
| Scale | Cronbach’s Alpha | Cronbach’s Alpha Based on Standardized Items | N of Items |
|---|---|---|---|
| Organizational Culture | .836 | .842 | 43 |
| National Culture | .770 | .773 | 23 |
| Project Performance | .804 | .802 | 19 |
| Project Performance | .804 | .802 | 19 |
| Interpersonal Conflict | .672 | .683 | 4 |
The organisational culture scale produces an α coefficient of 0.836, which is categorised as being ‘good’ according to Georgy and Mallery (2003), who stated that 0.9 ≥ α ≥ 0.8 is considered good. The national culture scale produced an α of 0.770, which is placed in the ‘acceptable’ category based on the rules of thumb asserted by DeVeillis (2012), Georgy and Mallery (2003), and Line (2000).
The scale items of project performance had produced an α of 0.804, which is again placed in the ‘good’ category of α. Lastly, the current study’s mediator created an α of 0.672, which is considered questionable by Georgy and Mallery (2003) and Kline (2000).
However, other notable studies like Gliem and Gliem (2003), Tayakol and Dennick (2011), and DeVeillis (2012) have attributed it to be acceptable under certain conditions. One of the most probable reasons for a slighter α value for interpersonal conflict can be attributed to the few items (i.e.4 questions) that composed the questionnaire section.
The data collected from the questionnaire was then analyzed for normality. To test for normality, the following hypotheses were developed:
H0: The sampled population is normally distributed.
H1: The sampled population is not normally distributed.
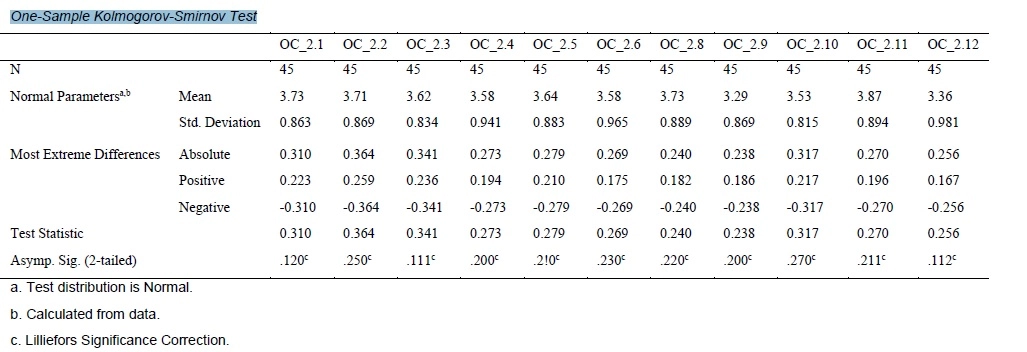
To test these hypotheses, the one-sample Kolmogorov-Smirnov (K-S) test for normality was conducted using IBM’s SPSS. The results of the test are displayed in the following tables for each of the measure items. These measures included organisational culture, national culture, interpersonal conflict, and project performance.
The results show that the population is usually distributed as shown by the values produced by the K-S statistic and the significance value being more significant than 0.05 (Sig.>0.05). In a normal distribution, the significance value must be greater than 0.05.
Hence, it can be concluded that there is not enough evidence to reject the claims that the sampled population is normally distributed. Therefore, the data in the study came from a normally distributed population. We leave the H1 hypothesis and accept H0. The tables were organised based on the item measures and broken down into parts to present them coherently.
Table 4.4- One-Sample K-S Test for Organizational Culture Part I
The data collected was then analysed for descriptive statistics to attain information on the study participants’ responses. Each of the sections in the questionnaire was divide based on their item measures and coherently presented.
The questionnaire’s organisational culture section contained 44 items: statements asking the respondents to present their opinion of agreement or disagreement by choosing from 1- strongly disagree to 5- strongly agree.
The analysis presented in Fig. () provides insight into the significant characters in the organisation where the participants were employed. Based on the responses to the questionnaire, the characteristics of the organisation were obtained.
The current study’s organisational culture comprises six dimensions – process-oriented vs results-oriented, employee-oriented vs job-oriented, parochial vs professional, open system vs closed system, loose control vs tight control, normative vs pragmatic.
The opinions presented by the respondents collectively provided insight into the general organisational culture of the information technologies that they worked in.
For example, the first 13 questions were asked based on the dimensions of process-oriented vs results-oriented culture in the organisation. Question 2.11 stated, ‘mistakes are tolerated in the organisation’, in which 47.7% indicated that they agreed while 24.4% said they strongly agreed. In statement 2.1, participants were asked to give an opinion on the statement, ’employees are told when a good job is done, to which 53.3% had agreed, and 15.6% strongly agreed.
To the statement, ‘each day in the organisation brings new challenges,’ 46.7% of respondents indicated they agreed while 13.3% stated they strongly agreed. To the statement in 2.8, ‘organisation members try to be pioneers,’ 42.2% indicated they agreed, while 20.0% indicated that they strongly agreed. Based on these indications, it is concluded that the participants work in a process-oriented organisation.
The next dimension studied in this section was employee-oriented vs job-oriented. To statement 2.16, ‘organisation is only interested in work people do,’ 48.9% of participants said they agreed, and 17.8% indicated that they strongly agreed. Subsequently, statement 2.17 ‘decisions in the organisation are centralised at the top’ with 46.7% agreeing to the statement and 22.2% strongly agreeing.
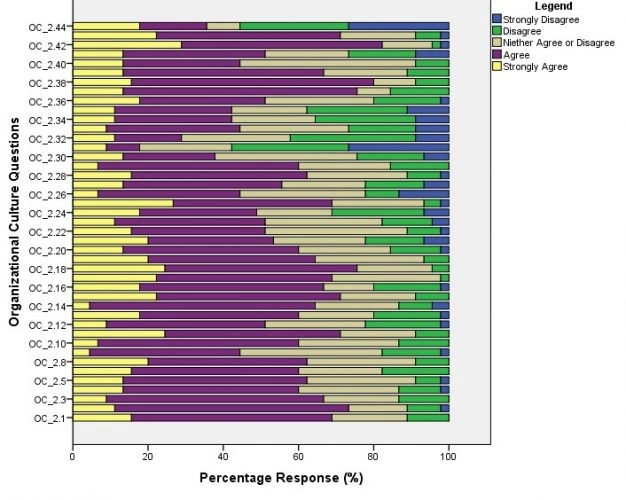
Figure 4.5- Descriptive Statistics for Organizational Culture Responses (Source; Questionnaire)
To add to this, 2.19 asked opinions for the following statement, ‘changes are imposed by the management decree,’ 44.4% agreed to the statement while 20.0% strongly agreed to the statement. Statement 2.33 ‘litter concern is placed for employees’ problems, with 40.0% of participants agreeing to the statement and 11.1% strongly agreed to this statement.
Based on the trends of the responses for this section, it is concluded that the participants are working in organisations categorised as job-oriented. When investigating participant’s work environment based on culture, parochial vs professional culture was also examined. Based on the results, it is evident that participants in the current study work within a professional culture.
This is evidenced by participants agreeing to statements like ‘there are cooperation and trust between departments, to which 53.3% of participants agreed while 6.7% strongly agreed.
The next portion of the descriptive statistics analysis used the responses from the section on national culture. Figure 4.6 illustrates participant responses to the questions.
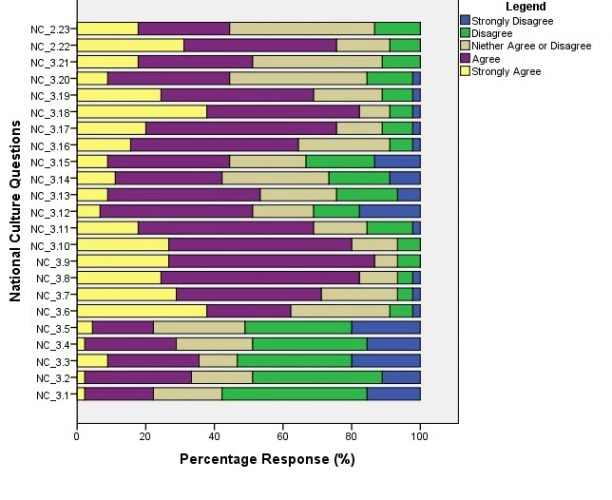
Based on the descriptive statistics displayed above, the national culture permeates through the respondents’ organisation is highly masculine. A majority of the respondents indicated that female lead meetings, female lead leadership positions, and female presence in the work environment do not provide the overall organisation with positive results.
The questionnaire responses indicated by 87.54% that females could not undertake problem-solving situations as females did not have the natural inherent qualities or characteristics associated with men. The descriptive statistics also indicated that 78.55% of responses using agreed or strongly agreed that the work environment was rigid and tight, reflecting the national culture that influences the organisation.
Of the questionnaire’s total items, four questions asked respondents to indicate their opinions based on the conflict present in the organisation they are employed in. Figure 4.7 illustrates the responses of the participants. 82.87% of the respondents indicated that there was a great presence of friction in their teamwork. Respondents, about 75.32%, indicated using agreed or strongly agree that “there is a large extent of personality clashes in your work team.”
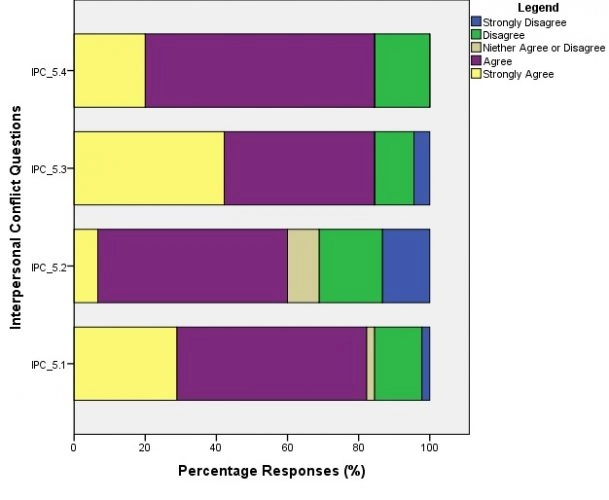
Furthermore, participants, about 88.39% in the current study, indicated using the opinions of strongly agree and agree that “there is great strain interpersonal relationship present in your work team.” Lastly, 88.70% of respondents agreed and strongly agreed to the statement, “there is a great amount of mood conflict in your work team.” The descriptive statistics results indicate that the participants in the current study have a great deal of experience being made in the interpersonal conflict within their organisations.
To assess the model’s measures’ reliability and consistency, it was necessary to construct a measurement model. The measurement for the current study and its various items have been displayed in Appendix B.
The measurement model is considered valid because of the composite reliability and average variance extracted. In reflective measures, is it necessary for construct loadings to be greater than 0.7, which our model satisfies? It is also recommended to have an AVE of over 0.5 (>0.5), which the current measurement model satisfies.
Lastly, composite reliability (CR) is recommended above 0.70 (>0.70). The current model satisfies therefore considered reliable and valid for its latent variables to be analysed.
To further ensure that the measurement model was satisfactory for analysing a structural model, it was necessary to also present cross-loadings. Using cross-loadings data, one can determine that item measures’ correlation is highest under their latent variable. If this is the case, then the measurement model items are considered as reliable.
The table (4.11) below presents the cross-loadings of the current model.
| Interpersonal Conflict | National Culture | Organizational Culture | Project Performance | |
|---|---|---|---|---|
| IPC 5.1 | 0.144 | 0.12 | 0.055 | 0.132 |
| IPC 5.2 | 0.739 | 0.071 | 0.244 | 0.118 |
| IPC 5.3 | 0.585 | -0.142 | -0.373 | -0.093 |
| IPC 5.4 | 0.625 | 0.193 | 0.249 | 0.156 |
| NC 3.1 | -0.067 | 0.023 | -0.015 | -0.121 |
| NC 3.10 | -0.008 | 0.059 | 0.017 | 0.007 |
| NC 3.11 | 0.06 | 0.423 | 0.116 | 0.174 |
| NC 3.12 | -0.11 | 0.648 | 0.403 | 0.458 |
| NC 3.13 | 0.071 | 0.656 | 0.355 | 0.465 |
| NC 3.14 | -0.092 | 0.759 | 0.462 | 0.617 |
| NC 3.15 | 0.095 | 0.67 | 0.303 | 0.494 |
| NC 3.16 | 0.043 | 0.153 | 0.051 | 0.149 |
| NC 3.17 | 0.01 | 0.196 | 0.169 | 0.155 |
| NC 3.18 | -0.12 | 0.152 | 0.134 | -0.027 |
| NC 3.19 | -0.009 | 0.407 | 0.393 | 0.254 |
| NC 3.2 | 0.125 | 0.129 | -0.016 | 0.06 |
| NC 3.20 | -0.131 | 0.674 | 0.556 | 0.63 |
Now that the measurement model is considered robust, it becomes necessary to analyse the study’s structural model. The figure below 4.8 presents the study’s structural model and presents its beta values known as path coefficients.
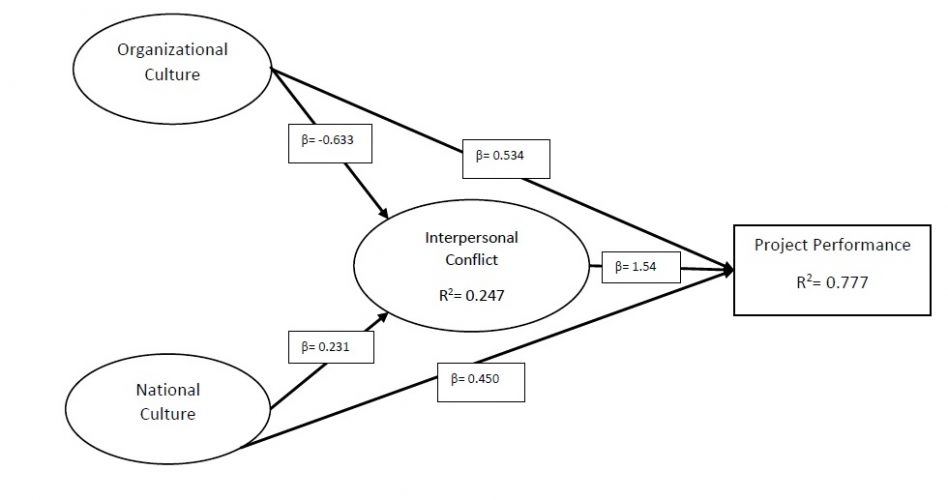
Figure 4.8- Structural Model Output Based on Path Coefficients
Based on the structural model in the figure above 4.9, the R2 values for project performance are produced as 0.777, which is considered to be substantial. On the other hand, the R2 value produced for internal conflict is taken as 0.247, which many scholars consider poor or weak.
The following tables were made to understand better the structural model and test for hypotheses in the study, which identified the t statistic to determine the path’s significance.
Based on these results, the direct effects are evident in which national culture directly affects project performance, as does national culture in terms of indirect effects or mediation. Both the hypotheses are accepted, which shows that there is partial mediation.
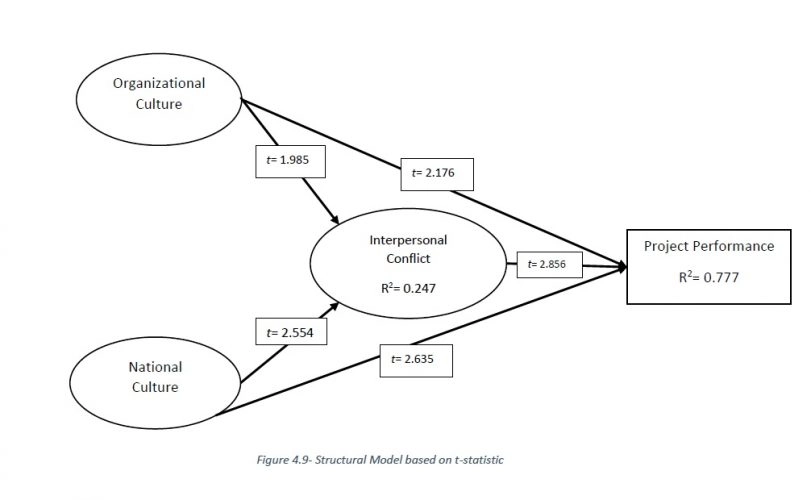
Figure 4.9- Structural Model based on t-statistic
Table 4.12- Structural Model Hypothesis Testing for Direct Results
Abramson, L. Y., Seligman, M. E., & Teasdale, J. D. (1978). Learned helplessness in humans: critique and reformulation. Journal of Abnormal Psychology, 87(1), 49–74.
Aibinu, A. A., & Al-Lawati, A. M. (201). Using PLE-SEM technique to model construction organizations’ willingness to participate in e-bidding. Automation in Construction, 19, 714-724.
Akkermans, H., & Helden, K. van. (2002). Vicious and virtuous cycles in ERP implementation: a case study of interrelations between critical success factors. European Journal of Information Systems, 11(1), 35–46. https://doi.org/10.1057/palgrave.ejis.3000418.
Babbie, E. R. (2013). The Basics of Social Research. Cengage Learning.
Barclay, D., Thompson, R., & Higgins, C. (1995). The partial least squares (PLS) approach to causal modelling: Personal computer adoption and use as an illustration. Technology Studies, 2(2), 285-309.
Campbell, D. T. & Fiske, D. W. (1959). Convergent and discriminant validation by the multitrait-multidimensional matrix. Psychological Bulletin, 56, 81-105.
Chin, W. W., Kim, Y. J., & Lee, G. (2013) Testing the differential impact of structural paths in PLS analysis: A bootstrapping approach. In H., Abdi et al. (Eds.), New Perspectives in Partial Least Squares and Related Methods, Vol. 56, pp. 221-229). New York: Springer.
Cohen, S. (2004). Social Relationships and Health. American Psychologist, 676–684.
Cohen, S., & Wills, T. A. (1985). Stress, social support, and the buffering hypothesis. Psychological Bulletin, 98(2), 310–357.
Cooper, H. (2003). Psychological Bulletin: Editorial. Psychological Bulletin, 129, 3–9. https://doi.org/10.1037/0033-2909.129.1.3
Creswell, J. W. (2014). Research Design: Qualitative, Quantitative, and Mixed Methods Approaches. SAGE.
Gällstedt, M. (2003). Working conditions in projects: perceptions of stress and motivation among project team members and project managers. International Journal of Project Management, 21(6), 449–455. https://doi.org/10.1016/S0263-7863(02)00098-4.
Gefen, D., & Straub, D. W. (2000). The relative importance of perceived ease-of-use in IS adoption: A study of e-commerce adoption. Journal of the Association for Information Systems, 1(8), 1-30.
Gonzalez, V. M., Goeppinger, J., & Lorig, K. (1990). Four psychosocial theories and their application to patient education and clinical practice. Arthritis & Rheumatism, 3(3), 132–143. https://doi.org/10.1002/art.1790030305
Haynes, N. S., & Love, P. E. D. (2004). Psychological adjustment and coping among construction project managers. Construction Management and Economics, 22(2), 129–140. https://doi.org/10.1080/0144619042000201330
Hayes, A. F. (2009). Beyond Baron and Kenny: Statistical mediation analysis in the new millennium. Communication Monographs, 76(4), 408-420.
Henseler, J. (2017). Bridging design and behavioural research with variance-based structural equation modelling. Journal of Advertising, 46(1), 178-192.
Henseler, J., Ringle, C. M., & Sinkovics, R. R. (2009). The use of partial least squares path modelling in internal marketing. In R. R. Sinkovics & P. N. Ghauri, (Eds.), Advances in International Marketing, 20, pp. 277-320. England: Bingley.
Hulland, J. (1999). Use of partial least squares (PLS) in strategic management research: A review of four recent studies. Strategic Management Journal, 20, 1950 204.
Islam, M. D. M. & Faniran, O. O. (2005). Structural equation model of project planning effectiveness. Construction Management and Economics, 23(2), 215-223.
J. Bem, D. (1995). Writing a review article for Psychological Bulletin. Psychological Bulletin, 118, 172–177. https://doi.org/10.1037/0033-2909.118.2.172
Jensen, M. P., Moore, M. R., Bockow, T. B., Ehde, D. M., & Engel, J. M. (2011). Psychosocial Factors and Adjustment to Chronic Pain in Persons With
Physical Disabilities: A Systematic Review. Archives of Physical Medicine and Rehabilitation, 92(1), 146–160. https://doi.org/10.1016/j.apmr.2010.09.021
Lazarus, R. S., & Folkman, S. (1984). Stress, Appraisal, and Coping. Springer Publishing Company.
Lehman, R. S. (1991). Statistics and Research Design in the Behavior Sciences. Florence, KY: Wadsworth.
Leung, M., Chan, Y. S. I., & Dongyu, C. (2011). Structural linear relationships between job stress, burnout, physiological stress, and performance of construction project managers. Engineering, Construction and Architectural Management, 18(3), 312–328. https://doi.org/10.1108/09699981111126205
Leung, M., Chan, Y.-S., & Olomolaiye, P. (2008). Impact of Stress on the Performance of Construction Project Managers. Journal of Construction Engineering and Management, 134(8), 644–652. https://doi.org/10.1061/(ASCE)0733-9364(2008)134:8(644)
Leung Mei-yung, Chan Yee-Shan, & Yu Jingyu. (2009). Integrated Model for the Stressors and Stresses of Construction Project Managers in Hong
Kong. Journal of Construction Engineering and Management, 135(2), 126–134. https://doi.org/10.1061/(ASCE)0733-9364(2009)135:2(126)
Leung, M. Y., Ng, S. T., Skitmore, M., & Cheung, S. O. (2005). Critical stressors influencing construction estimators in Hong Kong. Construction Management and Economics, 23(1), 33-43.
Macleod, J., & Smith, G. D. (2003). Psychosocial factors and public health: a suitable case for treatment? Journal of Epidemiology & Community
Health, 57(8), 565–570. https://doi.org/10.1136/jech.57.8.565
Malik, A. R. (2017, May 31). Pakistan: The Next Asian Tiger? The Diplomat. Retrieved from https://thediplomat.com/2017/06/pakistan-the-next-asian-tiger/
Mallet, R., Hagen-Zanker, J., Slater, R., and Duvendack, M. (2012). The benefits and challenges of using systematic reviews in international development research. Journal of Development Effectiveness, 4(3), 445-455.
Michie, S. (2002). Causes and Management of Stress at Work. Occupational and Environmental Medicine, 59(1), 67–72. https://doi.org/10.1136/oem.59.1.67
Newton, V., Greenberg, A., & See, J. (2017). Project Management Implications and -Implementation Roadmap of Human Readiness Levels. In HCI in
Business, Government, and Organizations. Interacting with Information Systems (pp. 99–111). Springer, Cham. https://doi.org/10.1007/978-3-319-58481-2_9
Nightingale, A. (2009). A guide to systematic literature reviews. Surgery (Oxford), 27(9), 381-384.
Nitzl, C., Roldan, J. L., and Cepeda-Carrion, G. (2016). Mediation analysis in partial least squares path modelling: Helping researchers discuss more sophisticated models. Industrial Management & Data Systems, 116 (9), 1849-1864.
Nunnally, J. C., (1976). Psychometric Theory. New York: McGraw-Hill.
Pinto, J. K., & Mantel, S. J. (1990). The causes of project failure. IEEE Transactions on Engineering Management, 37(4), 269–276. https://doi.org/10.1109/17.62322
Project Management Institute. (2017). A Guide to the Project Management Body of Knowledge (6th edition). Project Management Institute.
Preachers, K. J., & Hayes, A. F. (2008). Asymptotic and resampling strategies for assessing and comparing indirect effects in multiple mediatory models. Behaviour Research Methods, 40(3), 879-891.
Richmond, A., & Skitmore, M. (2006). Stress and coping: a study of project managers in a large ICT organization. Project Management Journal, 37(5), 5–16.
Seligman, M. E., & Maier, S. F. (1967). Failure to escape traumatic shock. Journal of Experimental Psychology, 74(1), 1–9.
Senaratne, S., & Rasagopalasingam, V. (2017). The causes and effects of work stress in construction project managers: the case in Sri Lanka.
International Journal of Construction Management, 17(1), 65–75. https://doi.org/10.1080/15623599.2016.1167358
Silva, M. (2015). A systematic review of foresight in project management literature. Procedia Computer Science, 64, 792-799.
Smith, D. C., Bruyns, M., & Evans, S. (2011). A project manager’s optimism and stress management and IT project success. International Journal of Managing Projects in Business, 4(1), 10–27. https://doi.org/10.1108/17538371111096863
Sobel, M. E. (1982). Asymptotic confidence intervals for indirect effects in structural equation models. Sociological Methodology, 13 290-312.
Thong, J. Y. L., & Yap, C.-S. (2000). Information systems and occupational stress: a theoretical framework. Omega, 28(6), 681–692. https://doi.org/10.1016/S0305-0483(00)00020-7
Vaghela, V., & Mangi, F. (2017, May 25). Investors Flock to Pakistan ETF Before Emerging Market Entry. Bloomberg.Com. Retrieved from https://www.bloomberg.com/news/articles/2017-05-25/investors-flock-to-pakistan-etf-ahead-of-emerging-market-upgrade
Wilson, J. (2010). Essentials of Business Research: A Guide to Doing Your Research Project. SAGE.
Would, H. (1980). Mode construction and evaluation when theoretical knowledge is scarce – theory and application of partial least squares (Kmenta, J., Ramsey, J. G., (Eds.). Evaluation of Econometric Models. New York: Academy Press.
To write the Results chapter of a dissertation:

All work is written by human writers. 100% AI free, guaranteed.

100% money back guarantee if you find plagiarism in our work.
COMPANY DETAILS


