Here is a sample that showcases why we are one of the world’s leading academic writing firms. This assignment was created by one of our expert academic writers and demonstrated the highest academic quality. Place your order today to achieve academic greatness.
The current chapter portrays the study results using the methodology outlined in the previous chapter. The study’s findings are presented in the chapter with a discussion of respondent characteristics using data acquired from the questionnaire in Appendix A, followed by a discussion on the data’s internal consistency and normality.
The concluding portions of the chapter consist of an in-depth discussion of the PLS-SEM results. The purpose of the chapter is to present statistical analysis conducted from respondents’ data to provide a meaningful result that will allow for conclusions to be drawn.
The total participants projected in the current study were 100 based on a population of private school teachers in the Islamabad, Wah Cantt, and Peshawar areas. Of the 100 questionnaires distributed by walk-ins, a total of 52 were returned to the research. The questionnaires were then organized, with only 34 included in the current study.
A total of 20 questionnaires were rejected from the sample as they were incompletely filled out, with the vast majority of this questionnaire have unanswered questions. The table below illustrates the response rate obtained in the current study categorized according to participants’ gender.
| Respondents | No. of Questionnaires Issued | No. of Questionnaires Returned | Response Rate (%) |
|---|---|---|---|
| Male | 50 | 6 | 12 |
| Female | 50 | 28 | 56 |
| Total | 100 | 34 | 34 |
The sample’s total response rate used in the current study is 34.00%, a low response rate. According to Fincham (2008), if a survey only achieves only about a 30 percent response rate, then it is implied that the study suffers from a 70 percent non-response bias. One way it is suggested to deal with lack of representativeness is to weigh the study sample segments to reflect the greater population attributes (Brick & Kalton, 1996).
The questionnaire contained a segment in which respondents were asked to indicate choosing those that best described their demographic characteristics. Demographic characteristics included gender, age group, years of experience, the highest level of education, and the hours per week that were worked. The responses are illustrated in the table below;
| Male | Female | ||
|---|---|---|---|
| Age Group | Under 30 From 30 t0 45 | 40.0% 60.0% | 59.3% 40.7% |
| Employment Experience | Less than 5 years From 5 to 10 years | 100.0% 0.0% | 72.7% 27.3% |
| Working Hours | Less than 5 hrs. | 0.0% | 0.0% |
| 5 to 10 hours | 32.1% | 0.0% | |
| 16 to 20 hours | 0.0% | 0.0% | |
| 21 to 30 hours | 10.7% | 0.0% | |
| 31 to 40 hours | 21.4% | 50.0% | |
| More than 40 hours | 35.7% | 50.0% | |
| Education | Matriculation | 0.0% | 0.0% |
| Intermediate | 0.0% | 0.0% | |
| Some College | 0.0% | 0.0% | |
| Bachelor’s Degree | 33.3% | 14.3% | |
| Graduate Degree | 66.7% | 85.7% | |
| Other | 0.0% | 0.0% |
Table 4.3-1 indicates that most participants’ responses were that of females, with 59.3% being below 30. The group of males participating in the current study includes 60 percent of the sample between 30 and 45 years old, and 40 percent are below 30. According to the demographic results, both males (66.7 percent) and females (85.7 percent) have their highest education level is a graduate degree.
While 33.3 percent of males had indicated their highest form of education was a Bachelor’s degree, and 14.3 percent of females showing in the sample that their most elevated form of education was a Bachelor’s degree. The sample indicated that the respondents had fewer than 5 years of employment, which was indicated by 72.27 percent of females in the affirmative while 100 percent did so.
The sample also indicated that 35.7 percent of female teachers had worked more than 40 hours a week, while 50 percent of male teachers stated this was their work schedule. Only 32.10 percent of female teachers indicated that they worked 5 to 10 hours a week.
To ensure that the questionnaire had reliability across its scale items, it was imperative to measure Cronbach’s alpha (α). The primary aim of using α was to measure how each of the questionnaire’s item measures was consistent with the concepts that it was hypothesized to measure. The questionnaire’s latent variables included procedural fairness, distributive fairness, interactive fairness, leader-member exchange, and employee performance.
The α coefficients needed to lie between the ranges of 0 and 1, which portrays the assessment of each measure’s reliability. If there is high covariance among the items, alpha starts to get closed to 1. This means that the higher the α coefficient, the more it is included in the items with a shared covariance and likely measures the same concept. For the current study, the α measured for each item in the questionnaire was tested using IBM SPSS v. 24. The results of the α coefficients are presented in table 4.4-1.
Table 4.3-1- Cronbach’s Alpha Results for Questionnaire
| Scale | Cronbach’s Alpha | N of Items |
|---|---|---|
| Procedural Fairness | .743 | 7 |
| Distributive Fairness | .751 | 4 |
| Interactive Fairness | .705 | 4 |
| Leader-Member Exchange | .784 | 7 |
| Employee Performance | .634 | 12 |
The analysis of alpha values is conducted using rules provided by DeVeillis (2012) and Kline (2000) who argued that “α ≥ 0.9 – excellent; 0.9 ≥ α ≥ 0.8- good; 0.8 ≥ α ≥ 0.7- acceptable; 0.7 ≥ α ≥ 0.6 questionable; 0.6 ≥ α ≥ 0.5- poor; and 0.5 ≥ α- unacceptable”. Based on this standard, it is evident that the α obtained from procedural fairness is acceptable as the produced value is 0.743.
The latent variables distributive fairness with α = 0.751, interactive fairness with an α of 0.705, and leader-member exchange with an α of 0.784 are also considered acceptable based on the rule thumb provided by DeVeillis (2012) and Kline (2000). However, the α value produced for the dependent variable employee performance was 0.634 in the ‘questionable’ category.
Notable studies such as Tayakol and Dennick (2011) and Gliem and Gliem (2003) have argued that even an α lying between 0.7 and 0.6 is acceptable. Studies like Cortina (1993) and Cheng et al. (2014) disagree on using α to check internal consistency. The researchers argue that an increased number of items on a questionnaire may inflate the α value artificially.
However, this may not be the case in the current study. As seen in table (), α values for latent variables with fewer item numbers produced a more acceptable alpha. In contrast, employee performance made an α questionable, although it had the highest number of items in the questionnaire.
The data collected was analyzed for descriptive statistics to acquire information on participants’ responses in the study. The questionnaire sections were divided based on the theme or variable they represented as evidence from their item measure.
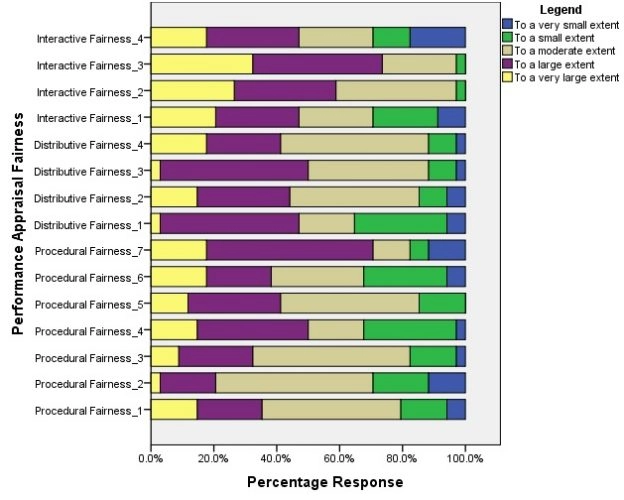
Performance appraisal fairness is composed of three-dimension – procedural fairness, distributive fairness, and interactive fairness. Within the questionnaire, performance appraisal fairness contained 15 questions for respondents to answer. The questions were organized to include 7 questions for procedural fairness, 4 questions for distributive justice, and 4 questions for interactive fairness.
Each of the questions was accompanied with responses that were made according to the Likert scale in which participants were asked to choose from 1- to a minimal extent, 2- to a small extent, 3- to a moderate extent, 4- to a large extent, and 5- to a considerable extent. Figure (4.5-1) illustrates the participants’ responses in the study, providing insight into their opinion of performance appraisal fairness in their respective private schools of employment.
According to the questionnaire responses, we observe that the employees’ overall opinion has a majority overall moderate response regarding their supervisor/managers procedural fairness. According to the questionnaire, a large percentage of employees, 44%, feel that they can express their personal views during these procedures to a moderate extent. 14.7% of employees feel that they can express their views considerably during these procedures, while only 5.9% feel that they can only express their views to a minimal extent.
14.7% of employees can express their views to a small extent, while the remaining 20.6% of employees can express their opinions to a large extent. Keeping these opinions in perspective, 50% of these employees feel that they influence the procedures’ decisions at a moderate level. 17.6& of employees think that they can influence the decisions made by the procedures by both a small and a large extent, while 11.8% feel that they influence decisions to a minimal extent. Only the remaining 2.9% of employees feel that they can influence the procedure’s decisions considerably.
According to the questionnaire, employees expressed their views on if the procedure is consistently applied by their supervisors/managers. 50% of employees feel that the used procedure’s consistency is moderate, while 2.9% feel that the procedure’s consistency is applied to a minimal extent.
Employees feel that the procedure consistency is applied to a small extent, only 14.7%, while 23.5% of employees felt the procedure’s consistency was applied to a large extent. The remaining 8.8% of employees felt the application of the procedure consistency was extensive. The procedure applied was then checked to observe any bias was involved in it. 35.3% of employees felt that the procedure was free of bias essentially, while 29.4% felt that the procedure was free of bias to a small extent.
2.9% of employees expressed that the procedure was free of bias to a minimal extent. In comparison, 11.8% of employees showed complete opposite views and claimed that the procedure was free of bias to a considerable extent. 17.6% of employees showed a moderate opinion in regards to the procedure being bias-free.
Next, the employees were asked if the procedure applied is based on accurate information, to which 44.1% of employees showed a moderate opinion. 29.4% of employees felt that the applied procedure was based on accurate information to a large extent. In comparison, 14.7% felt that the procedure was based on accurate information to a small extent.
11.8% of employees felt that the applied procedure was based on accurate information to a considerable extent. In contrast, no employee had an opposing opinion that the used procedure was based on precise information to a minimal extent. Next, the employees were asked if they could appeal the decision arrived at by the procedure(s) applied, to which 29.4% of employees had a reasonable response, 20.6% of employees said that they could appeal the decisions made by a large extent.
In comparison, 26.4% said that they were able to appeal the decisions to a small extent. 17.6% of the employees felt that they could appeal to a considerable extent the decisions arrived by those procedures. In comparison, 5.9% of employees felt that they could appeal decisions to a minimal extent.
Employees were then asked if the procedures upheld ethical and moral standards, to which 52.9% of employees felt that the procedures did to a large extent and another 17.6% felt that the procedures upheld moral and ethical standards to a vast extent. 11.8% of employees had a moderate response, while another 11.8% felt that the procedures upheld moral and ethical standards to a minimal extent. Only 5.9% of employees felt that the procedures upheld the moral and ethical standards to a small extent only.
Employees were then asked questions that referred to the outcome they received from the supervisor/manager, specifically performance appraisal. Employees were first asked if those outcomes reflect the effort they put in their work, to which 44.1% of employees said that it did to a large extent and another 2.9% said it did to a considerable extent.
29.4% of employees felt that the outcome reflected their efforts to a small extent, while another 5.9% felt that their efforts were reflected in the outcome to a minimal extent. 17.6% of employees had a reasonable response. The employees were then asked if the outcome was appropriate to the work they completed, to which 41.2% of employees had a reasonable response. 29.4% of employees felt the outcome was appropriate to a large extent, while another 14.7% felt the outcome was appropriate to a considerable extent.
A total of 8.8% of employees felt that the outcome of their work completed is appropriate to a small extent. In comparison, another 5.9% of employees felt their work’s outcome is appropriate to the outcome to a minimal extent. The employees were then asked if the outcome of the procedures used reflected their contribution, to which a large percentage of employees, 47.1%, felt that it did to a large extent. In comparison, another 2.9% thought that the outcome reflected their contribution to a considerable extent.
Another 8.8% of employees reflected their contribution to a small extent, and another 2.9% of employees felt that the outcome reflected their contribution to a minimal extent. 38.2% of employees felt that the outcome reflected their contributions to a moderate extent. Each employee was asked if the outcome was justified following their performance, to which 47.1% gave a moderate response.
A percentage of 23.5% of employees felt that the outcome justified their performance largely, and another 17.6% of employees felt that the outcome justified their contributions to a considerable extent. A small percentage of 2.9% of employees felt that the outcome reflected their contribution to a minimal extent. In comparison, 8.8% of employees felt that the outcome produced reflected their performance to a small extent.
Now the employees were asked questions regarding the interaction between the supervisor/manager and the employees. The first question asked was if he/she politely treats the employee. To this question, 20.6% said that the employer politely treated them to a considerable extent. About 26.5% of employees said that the employer politely treats them to a large extent.
23.5% of employees said that the employer politely treats them to a moderate extent, while 20.6% of employees feel that their employer politely treats them to a small extent. However, a percentage of 8.8% of employees think that their employer politely treats them to a minimal extent.
Employees were then asked if the employer treats them with dignity, to which 38.2% of employees said to a moderate extent, while 32.4% said that the employer did to a considerable extent. In comparison, 26.5% felt that the employer treats them with dignity to a considerable extent. A percentage of 2.9% of employees feel that their employer treats them with dignity to a small extent, and no employee feels that the employer treats them with dignity to a minimal extent.
Next, the employees were asked if the employer treated them concerning, which no employee felt that the employer did to a minimal extent, and 2.9% of employees felt that the employer treated them to a small extent. 23.5% of employees felt that their employer treats them to a moderate extent, while 41.2% feel that their employer treats them largely.
Another 32.4% of employees feel that their employers treat them to a considerable extent. Now it was observed if the supervisor/manager refrains from making improper remarks or comments to the employee, to which 17.6% of employees said that their employer does refrain from such remarks and comments to a considerable extent.
Another 17.6% of employees said that their employer refrains from such remarks and comments ta a minimal extent. A percentage of 29.4% of employees said that their employers refrain from obscene remarks and comments to a large extent. In comparison, an opposing 11.8% of employees said that their employers refrain from improper remarks and comments to a small extent. About 23.5% of employees said their employers refrain from obscene remarks and comments to a moderate extent.
Orders completed by our expert writers are
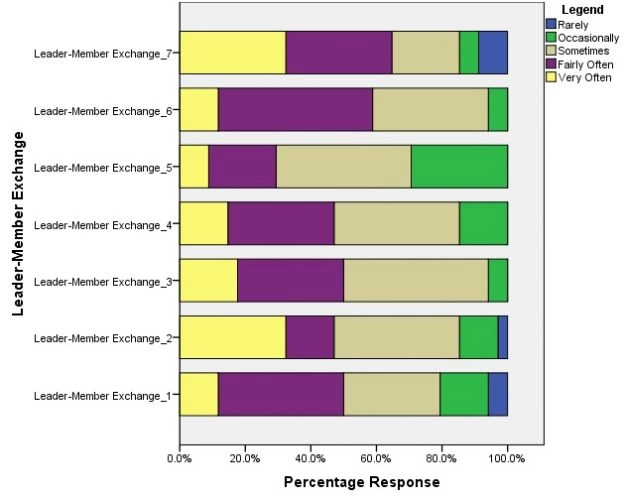
The employees were then asked questions based on their immediate boss’s relationship: the person they work under or report to. The employees were first asked is if they know where they stand with their boss or if they know if they are satisfied with their work, to which 38.2% of employees replied that they reasonably often do.
11.8% of employees replied that they very often know if their boss is satisfied with their work. 29.4% of employees replied that they sometimes know, 14.7% of employees occasionally know where they stand with their immediate boss. Only 5.9% of employees rarely know where they stand.
They were next asked if their boss understands their job problems and need, from which 32.4% of employees replied that their boss does very often. 14.7% said their boss understands their job problems and needs fairly often. Another 38,2% said their bosses understood sometimes, 11.8% replied that their bosses understood occasionally, and 2.9% of employees replied that their bosses understood their job needs and problems rarely.
The next question was to see if the immediate boss recognizes their employees’ potential, according to which 44.1% sometimes replied, 17.6% replied very often, and 32.4% replied fairly often. No employee replied that their boss did not recognize their potential, and only 5.9% replied that their boss recognized their potential occasionally.
If their boss will use their power to help their employee solve work-related problems, 38.2% of employees replied that they sometimes would, whereas 14.7% replied that their boss would use their power to solve work-related problems very often. 32.4% of employees replied that their boss would use their power fairly often. In comparison, 14.7% of employees reply that their boss occasionally uses their power to solve work-related issues using their power. No employee replied that their boss would not solve work-related problems using their power.
The employees were then asked that, regardless of the amount of formal authority, would the boss “bail them out” at their own cost, to which 41.2% employees responded that their boss would sometimes whereas 8.8% said very often their boss would, 20.6% said that they would get bailed out fairly frequently, 5.9% said occasionally.
No employee replied that their boss rarely would bail them out at their expense. The employee was then asked about their confidence in their boss’s decisions, to which 47.1% of employees agree with their boss, 11.8% strongly agree, 35.3% of employees are neutral, 5.9% disagree with bosses, but no employee strongly disagrees with the decisions made by the boss.
The employees were then asked to characterize their working relationship with their boss to according which 32.4% of employees said that it was highly effective, another 32.4% said it was better than average, 20.6% said it was average, 5.9$ said it was worse than average, and 8.8% said it was highly ineffective.
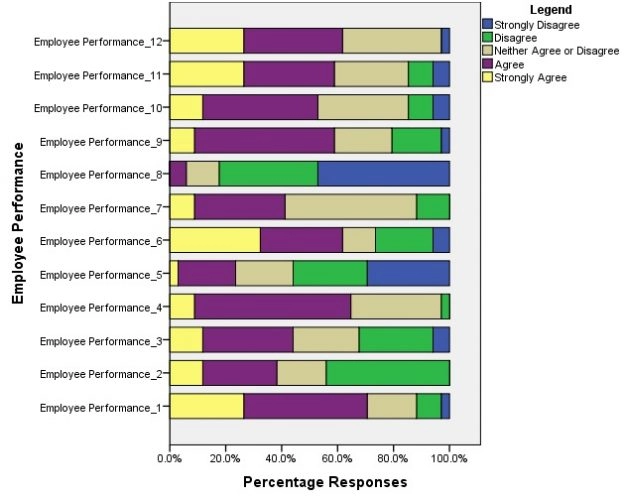
The final part of the questionnaire was focused on the employees’ performance. The employee must have been employed for at least six months. These questions are some statements regarding how the employee acts typically during their job. First, the employees were asked if they needed to perform an unfamiliar task.
They will seek information allowing them to complete it, to which 26.5% strongly agreed, 44.1% agreed, 17.6% of employees were neutral, 8.8% disagreed, and 2.9% strongly disagreed. Employees were then asked if they could execute their tasks if they had a certain amount of experience, to which 11.8% of employees strongly agreed, 26.5% of employees agreed, 17.6% were again neutral, 44.1% disagreed, and no employee strongly disagreed.
Next, they were asked if the basic tasks are not always in agreement with what they can do, to which 11.8% strongly agreed, 32.4% agreed, 23.5% were neutral, 26.5% disagreed, and 5.9% strongly disagreed. Overall, we can observe that many employees either agree or have a neutral feeling regarding their performance in their workplace.
When conducting a PLS analysis, it is imperative to maintain the validity and reliability of the measurement instrument to ensure that the results are credible. In terms of defining this principle – validity means the accuracy of results, while reliability is the consistency of the measuring instruments (Hair et al., 2006).
According to Fornell & Larcker (1981), it is critical to portray convergent validity and discriminant validity in quantitative research as they are used to measure the measuring instrument’s validity and reliability. Fornell & Larcker (1981) assert that convergent validity can be analyzed using “indicator loading, composite reliability and average variance extracted (AVE), and Cronbach’s alpha coefficient.”
On the other hand, discriminant validity can be measured using item cross-loadings used to develop then correlations square root of the AVE of each correlation of the latent variables to others. The research model’s assessment is necessary as it establishes whether a relationship exists between independent variables as their dimensions, measured using factor loading, convergent validity, and discriminant validity of the research instrument.
Hulland (1999) defines individual item reliability as the “extent to which measurements of latent variables measured with multiple-item scale reflects almost the true score of the latent variables relative to error.” In the current study, standardized loadings assess individual item reliability as produced using SmartPLS 3.0. Lee (2012) defines a standardized rule as a threshold to accept items, appointed as items with loadings of 0.7 or more to be acceptable.
Having acceptable loadings suggests a presence of shared variance between the independent variables and their item measures than a compared error (Coltman et al., 2008). According to Jarvis et al. (2003), loadings in actuality are correlations. If a loading of 0.7 exists, an estimated 50 percent variance is found in the observed variables that come from their latent variables.
It is advised by Nunnlly (1976) that items which are found to have low loadings need to be reviewed or removed as they have very little explanatory power in the model. They cause the model to exert bias from their parameters. The removed items included; PF1, PF4, PF6, DF4, IF4, and LMX4.
Hulland (1999) argues that loadings of less than 0.5 and 0.4 need to be removed from the latent variable. However, Fornell and Larcker (1981) have suggested that the loading of 0.7 needs to be maintained to ensure that no bias occurs in the model. Consequently, Chin (1998) asserts that if scales are adapted from another setting or are recently developed, then loading of 0.5 may be used to accept loading.
Barclay et al. (1995) also had made a similar assertion, stating that if instruments are developed under a specific context and are applied differently from their original concept, then a loading lower than 0.7 becomes acceptable as a threshold for analysis, as seen in table 4.6-1.
Hulland (1999) and Hair (2016) assert that a study needs to include the reliability of discrete dimensions and measures that involved convergent validity. Liao and Cheung (2002) defined convergent validity as “a measure of internal consistency within the SEM model.” The measure is used to ensure that items can quantify their latent variable and not one another.
Using PLS, convergent validity can be measured through composite reliability (CR) scores and average variances extracted (AVE). Anderson and Gerbing (1988) assert that composite reliability (CR) is similar to Cronbach’s alpha. However, the calculation method and formula are entirely different.
Pedhazur (1982) asserts that CR scores are superior to Cronbach’s alpha when measuring internal consistency as it can use item loadings that are an output of the theoretical model. When contrasting to Cronbach’s alpha, the CR weighs all items equally without considering their factor loadings. According to Nunnally (1978), 0.7 is the benchmark used to describe “modest composite reliability,” as seen in table 4.6-1.
The current research uses Smart PLS to develop composite reliabilities, illustrated in the measurement model output in table 4.6-1. The benchmark for assessing the CR was adapted from Nunnally’s benchmark (1978) of 0.7. The research was able to produce CR of all constructs demonstrated that as being acceptable level. Therefore, it is concluded that the measurement items are appropriate for their latent variables.
The research also included average variance extracted (AVE), calculated to examine the latent variables’ convergent validity. Cohen (1988) points out that AVE provides the variance that an independent variable can retain from its measurement items comparatively to variance from measurement errors.
The measurement requires that its latent variables illustrate 50 percent of the variance. The study’s AVE estimates are included in table 4.6-1, displaying all outcomes for the measurement model. According to the table, as are about 50 percent for all the latent variables in the model.
The results presented in the measurement model conclude that convergent validity exists in the current model. It is concluded that measurement items for each latent construct can measure them and not each other.
Table 4.5-1: Measurement Model
| Items | Loading | AVEb | CRc | Rho_A | |
|---|---|---|---|---|---|
| Procedural | PF2 | 0.782 | 0.665 | 0.888 | 0.883 |
| Fairness | PF3 | 0.816 | |||
| PF5 | 0.895 | — | — | — | |
| PF7 | 0.762 | — | — | — | |
| Distributive | DF1 | 0.919 | 0.776 | 0.912 | 0.938 |
| Fairness | DF2 | 0.774 | — | — | — |
| DF3 | 0.94 | — | — | — | |
| Interactive | IF1 | 0.93 | 0.765 | 0.907 | 0.895 |
| Fairness | IF2 | 0.854 | — | — | — |
| IF3 | 0.838 | — | — | — | |
| Leader | LMX1 | 0.854 | 0.517 | 0.864 | 0.845 |
| Member | LMX2 | 0.766 | — | — | — |
| Exchange | LMX3 | 0.76 | — | — | — |
| LMX5 | 0.729 | — | — | — | |
| LMX6 | 0.712 | — | — | — | |
| LMX7 | 0.764 | — | — | — | |
| Employee | EP1 | 0.745 | 0.544 | 0.726 | 0.743 |
| Performance | EP2 | 0.787 | — | — | — |
| EP3 | 0.73 | — | — | — | |
| EP4 | 0.717 | — | — | — | |
| EP5 | 0.778 | — | — | — | |
| EP6 | 0.739 | — | — | — | |
| EP7 | 0.5786 | — | — | — | |
| EP8 | 0.768 | — | — | — | |
| EP9 | 0.734 | — | — | — | |
| EP10 | 0.702 | — | — | — | |
| EP11 | 0.738 | — | — | — | |
| EP12 | 0.742 | — | — | — |
Initial assessment using the convergent validity of the measurement model completed allows for assessing the measurement’s discriminant validity. Carmines and Zeller (1979) define discriminant validity as the ability to indicate the extent to which a specific latent variable is different from other latent variables in the model. To assess this function, the tests of analysis of cross-loadings and analysis of AVE were required.
Campbell and Fiske (1959) require that cross-loadings be analyzed using the benchmark of items having a higher correlation with their respective latent variables that they are being used to measure than others in the model. SmartPLS was used to produce latent variable scores for all variables while computing standardized scores for the measurement item to calculate these values. The scores produced were then inserted into SPSS to calculate a Pearson’s correlation coefficient value for all item measures against their respective independent variable score.
The results of the correlation are illustrated in table 4.6-2. The table demonstrates that all of the measurement items’ loadings are greater in value for their respective latent variable than other latent variables in the model. Based on the results, it is concluded that each item measures its respective latent variable in the model, which is theoretically specified. Therefore, the cross-loading analysis indicates that all measurement items loaded evidently on their specific latent variable, demonstrating that the latent variables’ discriminant validity exists.
Table 4.5-2: Indicator Item Cross Loading
| Procedural Fairness | Distributive Fairness | Interactive Fairness | LMX | Employee Performance | |
|---|---|---|---|---|---|
| PF2 | 0.782 | 0.455 | 0.023 | 0.167 | 0.141 |
| PF3 | 0.816 | 0.4 | 0.245 | 0.308 | 0.254 |
| PF5 | 0.895 | 0.414 | 0.169 | 0.258 | 0.227 |
| PF7 | 0.762 | 0.27 | 0.055 | 0.291 | 0.137 |
| DF1 | 0.514 | 0.919 | 0.317 | 0.464 | 0.421 |
| DF2 | 0.368 | 0.774 | 0.083 | 0.361 | 0.23 |
| DF3 | 0.377 | 0.94 | 0.421 | 0.541 | 0.472 |
| IF1 | 0.239 | 0.259 | 0.93 | 0.527 | 0.607 |
| IF2 | 0.008 | 0.217 | 0.854 | 0.427 | 0.419 |
| IF3 | 0.17 | 0.438 | 0.838 | 0.469 | 0.532 |
| LMX1 | 0.29 | 0.632 | 0.469 | 0.854 | 0.568 |
| LMX2 | 0.162 | 0.327 | 0.341 | 0.666 | 0.154 |
| LMX3 | 0.166 | 0.333 | 0.554 | 0.76 | 0.418 |
| LMX5 | 0.183 | 0.297 | 0.283 | 0.629 | 0.377 |
| LMX6 | 0.36 | 0.499 | 0.223 | 0.612 | 0.313 |
| LMX7 | 0.219 | 0.188 | 0.427 | 0.764 | 0.514 |
| EP1 | -0.124 | -0.035 | 0.355 | 0.139 | 0.645 |
| EP2 | 0.373 | 0.324 | 0.557 | 0.637 | 0.687 |
| EP3 | 0.338 | 0.125 | 0.26 | 0.141 | 0.663 |
| EP4 | 0.107 | 0.086 | -0.237 | 0.141 | 0.817 |
| EP5 | 0.356 | 0.333 | 0.143 | 0.385 | 0.778 |
| EP6 | -0.165 | 0.182 | 0.456 | 0.102 | 0.539 |
| EP7 | 0.098 | 0.305 | 0.375 | 0.31 | 0.586 |
| EP8 | 0.191 | 0.008 | -0.07 | -0.271 | 0.868 |
| EP9 | 0.072 | 0.358 | 0.138 | 0.129 | 0.834 |
| EP10 | 0.272 | 0.405 | 0.416 | 0.467 | 0.802 |
| EP11 | 0.167 | 0.141 | -0.147 | 0.081 | 0.838 |
| EP12 | 0.087 | 0.272 | 0.388 | 0.337 | 0.742 |
Furthermore, an imperative measure of assessing discriminant validity – AVE analysis – was also conducted using the methods highlighted by Aibinu and Al-Lawati (2010). It is asserted by Hair et al. (1998) that specific independent variables need to be able to share more than their characteristic of variance with its measure than compared to other variables in the model. According to Fornell and Larker (1981) AVE of an independent factor needs to produce a value that is more than the variance it may share between latent variables and other intendent factors.
It is a prerequisite for a successful measurement model to produce more significant variance between independent and measurement items than other variables in the model and their specific item measures. The current study demonstrates AVE’s analysis in the latent variables’ correlation matrix in table 4.6-3. The diagonal that has been bolded in the table illustrates the square root of the AVE. According to Fornell and Larcker (1981), successful discriminant validity is expressed when the diagonal values are greater than those found in the off-diagonal rows and columns.
Table 4.5-3: Discriminant Validity (Fornell and Larcker Criterion)
| Distributive Fairness | Employee Performances | Interactive Fairness | LMX | Procedural Fairness |
|---|---|---|---|---|
| 0.881 | — | — | — | — |
| 0.449 | 0.794 | — | — | — |
| 0.348 | 0.64 | 0.875 | — | — |
| 0.529 | 0.594 | 0.548 | 0.719 | — |
| 0.475 | 0.248 | 0.178 | 0.32 | 0.815 |
Therefore, it is concluded that there is no correlation between any two of the independent variables that are larger or equal to the square roots of the AVEs of the same variable. Hence, according to discriminant validity testing, there is no issue in the latent variables or their measurement variables.
The entire measurement model results illustrate that items and their measures have adequate individual item reliability, convergent validity, and discriminant validity. The latent variables are within the considerably acceptable range of error. The measurement model can demonstrate satisfaction necessary for testing the relationship among all the variables in the model.
The measurement model is seen to be robust enough to analyze the structural model of the research further. Figure 4.5-1 illustrates the current research’s structural model and presents the beta (β) values which are path coefficients. The structural model is used to measure and verify the hypotheses. Two variables are integrated to test the research’s structural model – variance (R2), and path coefficient strength (β), and significance (t-values). The study, which includes a total of six hypotheses, is tested. The results of the PLS bootstrapping are illustrated in the figure below.
According to the figure’s structural model, the R2 values for employee performance are produced as 0.651, which is considered moderate. The figure’s results can be interpreted as meaning that 65% percent of the independent variance variable can be explained by the 3 hypotheses, which have a variance about the minimum of 0.5, which is a suggested limit by Hair et al. (2017).
To improve the structural model’s comprehension and test for the hypotheses in the study, t-statistics were identified to determine the significance of the path. Based on the output of the direct effect displayed, hypotheses H3 were accepted. Acceptance of the hypothesis is evidence as it produces an at-value of 1.979, with an effect size (f2) of 0.4097 and a predictor relevance (q2) value of 0.0383. This was the only hypothesis accepted based on these benchmark values. H1 and H2 are rejected as they cannot reach the threshold of any of the benchmarks mentioned.
The results displayed in tables 4.5-4 present the status of the hypotheses based on their status as supported or unsupported using the t-statistic. The table also provides values for direct effects, significance, effect size, and predictor relevance of the 3 latent variables on employee performance. Hair et al. (2017) asserted that t-statistics of 1.96 are significant on the path allowing the assertion that their hypotheses are supported.
The direct hypotheses are composed of three hypotheses, with only H3 being significant as it produced a t-statistic that was greater than 1.96. According to the output displayed, LMX as a direct effect has great significance on the dependent variable. Although this is not a hypothesis per se, it is crucial to have this value for further moderation analysis.
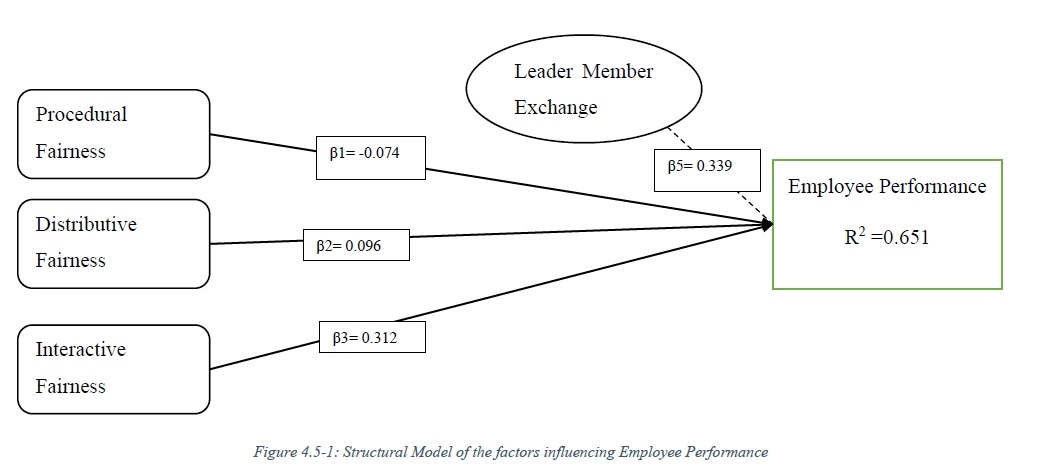
Table 4.5-4: Structural Model Hypothesis Testing for Direct Effects
| Hypothesis | Relationship | Std. Beta | Std. Error | [t-value]^2 | Decision | f2 | q2 | 95%CI LL | 95% CI UL |
|---|---|---|---|---|---|---|---|---|---|
| H1 | Procedural Fairness -> Employee Performance | -0.007 | 0.188 | 0.392 | Rejected | -0.0029 | -0.0033 | -0.305 | 0.315 |
| H2 | Distributive Fairness -> Employee Performance | 0.066 | 0.162 | 0.596 | Rejected | 0.0086 | -0.0033 | -0.2 | 0.331 |
| H3 | Interactive Fairness -> Employee Performance | 0.267 | 0.174 | 1.979 | Supported | 0.4097 | 0.0383 | -0.034 | 0.534 |
| LMX -> Employee Performance | 0.311 | 0.161 | 2.108 | Supported | — | — | 0.044 | 0.571 |
**p<0.01, *p<0.05
R2 (Organizational Cynicism= 0.892, Project Manager Performance= 0.947)
Effect Size impact indicator are according to Cohen (1988), f-values 0.35(strong), 0.15(moderate), 0.02(low)
Q2 (Organizational Cynicism= 0.671, Project Manager Performance= 0.657)
Predictive Relevance (q2) of Predictor exogenous latent variables as according to Henseler et al. (2009), q2 values, 0.35 (strong), 0.15 (moderate), 0.02(low).
According to Henseler and Fassott (2009), to analyze moderation effects, direct relationships between the exogenous and the moderator variable effects (i.e., b and c) and the interaction term ‘d’ with the endogenous variables must be assessed. The hypothesis on the moderating effect is considered supported by Henseler and Fassott (2009) is deemed to be supported if the path coefficient ‘d’ is significant regardless of the significance values of ‘a’ and ‘a’. It is essential that first, it is established if moderating effects exist by testing whether that path coefficient capturing the moderating effect differs significantly from zero. Next, it is essential to assess the strength of the moderating effect.
When conducting the moderation analysis, SmartPLS 3.0 was used, which simultaneously ran the analysis of the three moderation relationships. The model was bootstrapped with samples of 5000
Table 4.5-5: Hypothesis Testing for Moderating Effects
| Hypothesis | Relationship | Std. Beta | Std. Error | [t-value]^2 | Decision | f2 | q2 | 95%CI LL |
|---|---|---|---|---|---|---|---|---|
| H4 | PF->LMX -> Employee | — | — | — | — | — | — | — |
| Performance DF->LMX -> Employee | 0.103 | 0.166 | 0.308 | Rejected | 0.0029 | -0.167 | 0.377 | |
| H5 | Performance IF->LMX -> Employee | -0.024 | 0.199 | 0.101 | Rejected | 0.0000 | -0.346 | 0.305 |
| H6 | Performance | 0.384 | 0.184 | 2.055 | Supported | 0.1060 | 0.092 | 0.666 |
The significance of the R2 value was conducted using the effect size (f2). To do so, the structural model was assessed by exploring changes in the R2 to examine whether the impact of a specific mediator path on employee performance had a significant impact. The effect size f2 was calculated using the following formula.
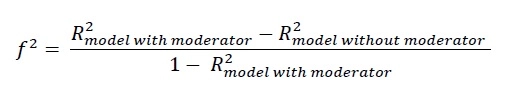
R2model with moderator and R2excluded is R2 on the dependent variable when the predictor moderator is used and then omitted in the structural equation in a specific sequence. Chin et al. (2003) argue that moderating with effect sizes of 0.02 are considered weak, 0.15 is moderate, and 0.35 is regarded as a strong effect. It is argued that a small effect size does not necessarily mean that the moderator’s effect is negligible. Instead, Chin et al. (2003) state, “Even a small interaction effect can be meaningful under extreme moderating conditions; if the resulting beta changes are meaningful, then it is important to take these conditions into account.”
As seen in table 4.5-5, it is evidence that hypotheses 4 and 5 are rejected as they are unable to show moderation. Both the hypotheses had produced an at-value of less than 1.96, meaning that their moderation was insignificant. However, H6 is accepted as it produced a value of 2.055 while also producing an effect size of 0.105, which is considered a moderate effect size according to Chin et al. (2003). Since only one model produces a moderation impact, the following graphical representation analysis is only conducted for moderation through interactive fairness.
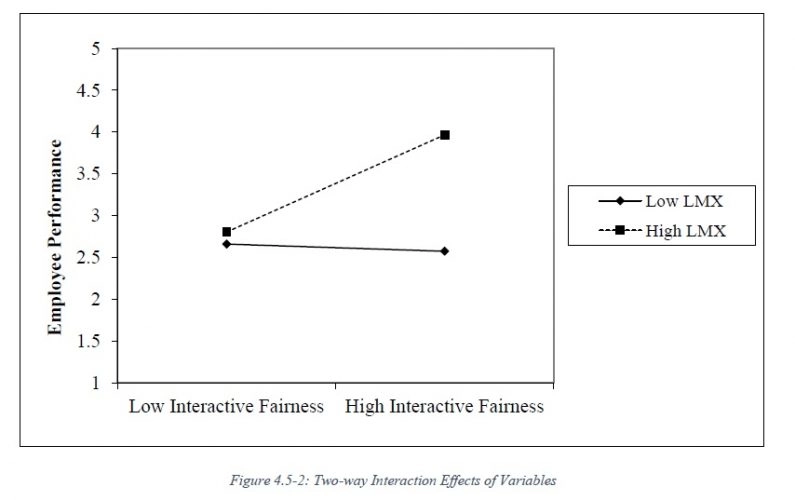
According to Figures 4.5-2, when there is a low leader-member exchange and low interactive fairness, employee performance is also lower. The trend is still persistent with low leader-member exchange and high interactive fairness. This allows for the conclusion that low leader-member exchange cannot change employee performance regardless of whether interactive fairness is high or low. On the other hand, the graph indicates that high leader-member exchange with low interactive fairness still produces employee performance. As interactive fairness gets higher under high LMX, so does employee performance. Graph 4.5-2 indicates low steepness with the moderator if low LMX is present but a steeper slope with high LMX.
The chapter examines the three latent variables and their relationship with the mediator variable leader-member exchange and the dependent variable employee performance. The chapter begins with assessing the reliability of all scale items in the questionnaire using Cronbach’s alpha. The results provided evidence to state that the questionnaire’s reliability was satisfactory based on the values of alpha produced.
To further the analysis, the study used Smart PLM to determine the research’s measurement and structural models. The measurement model was developed to examine each of the constructs’ items to ensure that they were reliable to be added to the study while maintaining convergent and discriminant validity. The measurement model analysis also used average variance extracted and construct reliability to examine the measures while producing cross-loading output.
To write the Results chapter of a dissertation:

All work is written by human writers. 100% AI free, guaranteed.

100% money back guarantee if you find plagiarism in our work.
COMPANY DETAILS


