Here is a sample that showcases why we are one of the world’s leading academic writing firms. This assignment was created by one of our expert academic writers and demonstrated the highest academic quality. Place your order today to achieve academic greatness.
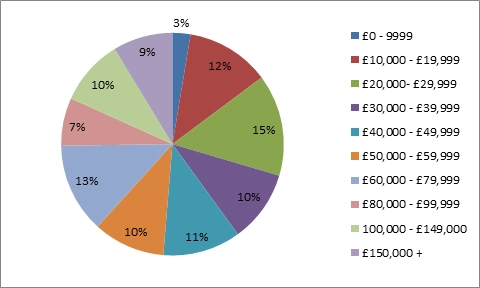
Based on the graphical representation, at least 49% of the total participants have a household income of more than £50,000, whereas 51% have less than £50,000 household income.
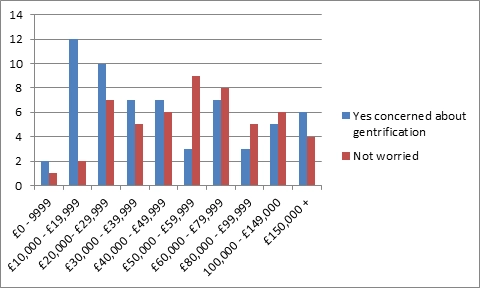
Furthermore, comparing the total number of participants having positive and negative perceptions of gentrification, it can be implicated that in the majority of the cases, either lower income or high income, positive perception towards gentrification was higher, except in a few cases, the negative perceptions were higher.
| Regression Statistics | ||||||||
| Multiple R | 0.178807 | |||||||
| R Square | 0.031972 | |||||||
| Adjusted R Square | 0.023405 | |||||||
| Standard Error | 2.605901 | |||||||
| Observations | 115 | |||||||
| ANOVA | ||||||||
| df | SS | MS | F | Significance F | ||||
| Regression | 1 | 25.344 | 25.344 | 3.732151 | 0.055878 | |||
| Residual | 113 | 767.3516 | 6.790723 | |||||
| Total | 114 | 792.6957 | ||||||
| Coefficients | Standard Error | t Stat | P-value | Lower 95% | Upper 95% | Lower 95.0% | Upper 95.0% | |
| Intercept | 4.152015 | 0.749498 | 5.539725 | 2E-07 | 2.667123 | 5.636906 | 2.667123 | 5.636906 |
| Household income | 0.943223 | 0.488242 | 1.931878 | 0.045588 | -0.02407 | 1.910519 | -0.02407 | 1.910519 |
Based on the findings from the data received on household income and the perception of gentrification, it can be seen that household income has a significant impact on perceptions of gentrification. Household income was the independent variable, and the perceptions of gentrification were the dependent variable. Based on the regression test, it was found that the p-value was less than 0.05 at 95% CI. Since the p<0.05, it may be stated that the household income level affects the positive and negative perceptions of gentrification.
Therefore, based on the findings from the regression, it is also indicative that richer people are more inclined towards positive gentrification perceptions. In contrast, people with lower income values may negatively perceive gentrification (Shaw and Hagemans, 2015). Therefore, the hypothesis that household income is influential on whether people support or do not support gentrification is accepted based on the p-value.
Shaw, K.S. and Hagemans, I.W., 2015. ‘Gentrification without displacement’ and the consequent loss of place: The effects of class transition on low‐income residents of secure housing in gentrifying areas. International Journal of Urban and Regional Research, 39(2), pp.323-341.
To write the introduction chapter of a dissertation:

All work is written by human writers. 100% AI free, guaranteed.

100% money back guarantee if you find plagiarism in our work.
COMPANY DETAILS


