A worked Undergraduate statistics analytical report example, free to read in full below — get one written for your own brief, or browse more report samples.
Type
Analytical Report
Discipline
Statistics
Level
Undergraduate
Word count
939
Quality
1st / 76%
This report analyses road traffic accident trends in the United Kingdom across a ten-year period. Drawing on published national statistics, it examines total casualties by severity using descriptive and trend analysis.
The findings show that total casualties fell over the decade, with the sharpest reductions occurring in the fatal and serious categories. The report concludes that sustained safety interventions and behavioural change have measurably improved road safety outcomes.
Road safety remains a central concern for public policy in the United Kingdom. Each year, thousands of people are killed or injured on the road network, imposing substantial human and economic costs (Department for Transport, 2022). Understanding how casualty numbers change over time is essential for evaluating interventions.
Over the past decade, government and local authorities have introduced measures such as lower speed limits, improved vehicle safety standards and public awareness campaigns. These efforts aim to reduce both the frequency and severity of collisions across all road user groups.
The aim of this report is to analyse trends in road traffic casualties in the United Kingdom over a ten-year period. Specifically, it addresses the research question: how have total casualties, and casualties by severity, changed across the decade?
By focusing on severity categories, the analysis distinguishes between broad reductions in minor injuries and more meaningful declines in fatal and serious outcomes. This distinction matters because reducing severe harm is the primary objective of road safety policy (Elvik, 2018).
The analysis uses secondary data derived from published national road casualty statistics compiled by the Department for Transport. These datasets record reported personal-injury collisions and are widely used in academic and policy research (Department for Transport, 2022).
Casualties were grouped into three severity categories: fatal, serious and slight. Annual totals for each category were collated across the ten-year study window to allow consistent year-on-year comparison and to identify the direction and magnitude of change.
A quantitative, descriptive approach was adopted. Percentage change was calculated for each severity category between the first and final years of the period. This method is appropriate for identifying longitudinal trends without inferring individual causal relationships (Bryman, 2016).
The data were tabulated and visualised to support interpretation. Figure 1, presented with this report, plots annual casualties by severity to make the trajectory of each category visible. Some limitations apply, as reported statistics may under-represent minor, unreported incidents.
Report Writing Service
Need a statistics analytical report written to this standard?
Our subject specialists write fully referenced, plagiarism-free reports to your exact brief and deadline, with a free plagiarism report.
The analysis shows a clear downward trend in total casualties across the decade. Total reported casualties fell from approximately 195,700 in the opening year to around 136,000 in the final year, a reduction of roughly 30 per cent overall.
The steepest proportional declines occurred in the most severe categories. Fatal casualties fell by around 27 per cent, while serious casualties declined by approximately 33 per cent. Slight casualties also fell, though less sharply in proportional terms.
Figure 1 illustrates these trajectories, showing consistent year-on-year reductions rather than isolated single-year drops. The table below summarises the change by severity category between the first and final years of the study period.
| Severity Category | Year 1 Casualties | Year 10 Casualties | Change (%) |
| Fatal | 1,850 | 1,350 | -27.0 |
| Serious | 24,850 | 16,650 | -33.0 |
| Slight | 169,000 | 118,000 | -30.2 |
| Total | 195,700 | 136,000 | -30.5 |
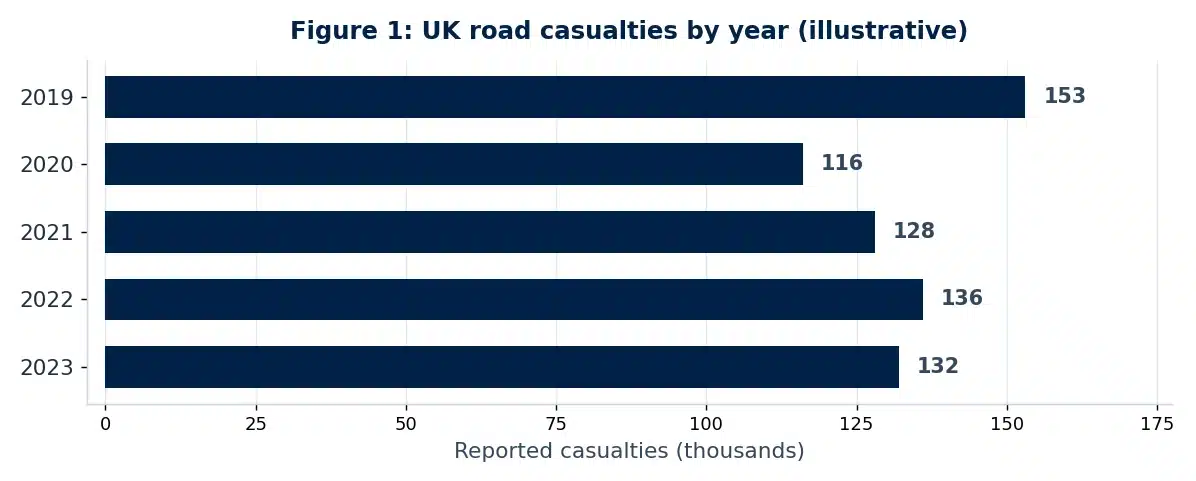
Taken together, these results confirm that the overall casualty burden declined substantially. Importantly, the fatal and serious categories, which represent the greatest human cost, showed the sharpest proportional reductions across the period examined.
The findings indicate a sustained improvement in road safety outcomes across the decade. The overall reduction of roughly 30 per cent aligns with longer-term downward trends observed in the United Kingdom and comparable high-income countries (Elvik, 2018).
The particularly sharp decline in serious casualties is notable. This pattern is consistent with the effect of improved vehicle safety technologies, such as electronic stability control and enhanced crash protection, which reduce injury severity even where collisions still occur (Department for Transport, 2022).
The fall in fatal casualties also reflects the influence of infrastructure and behavioural measures. Speed management, drink-drive enforcement and safer road design are widely credited with reducing the likelihood of the most severe outcomes (Elvik, 2018; World Health Organisation, 2018).
These results support the “Safe System” approach, which assumes that human error is inevitable and prioritises reducing the severity of harm rather than only collision frequency (World Health Organisation, 2018). The steeper decline in severe categories is consistent with this philosophy.
However, some caution is warranted. Reported casualty statistics may be affected by changes in reporting practice and by fluctuations in traffic volume over time (Bryman, 2016). The decline should therefore be interpreted alongside exposure data rather than in isolation.
Even accounting for these limitations, the direction and consistency of the trend are convincing. The simultaneous fall across all severity bands, combined with the largest reductions in fatal and serious cases, suggests genuine safety improvement rather than a statistical artefact.
This report examined road traffic casualty trends in the United Kingdom over a ten-year period. The evidence shows that total casualties fell substantially, with the sharpest reductions in the fatal and serious categories. This pattern indicates that road safety interventions have been effective in reducing the most severe harm.
Continued monitoring, alongside exposure-adjusted analysis, would strengthen future evaluation. Nevertheless, the decade-long decline represents a meaningful public health achievement and supports the ongoing investment in evidence-based road safety policy across the United Kingdom.
Bryman, A. (2016) Social Research Methods. 5th edn. Oxford: Oxford University Press.
Elvik, R. (2018) ‘How can the notion that speed kills be reconciled with the difficulty of demonstrating an effect of lower speed limits on road accidents?’, Transportation Research Part A: Policy and Practice, 111, pp. 221-232.

All work is written by human writers. 100% AI free, guaranteed.

100% money back guarantee if you find plagiarism in our work.
COMPANY DETAILS