Disclaimer: This is not a sample of our professional work. The paper has been produced by a student. You can view samples of our work here. Opinions, suggestions, recommendations, and results in this piece are those of the author and should not be taken as our company views.
Type of Academic Paper – Report
Academic Subject – Finance and Accounting
Word Count – 4432 words
It is critical to have a detailed knowledge of the firm’s liabilities and debt, as it is crucial to know the firm’s level of risk. A thorough understanding of these aspects will help in a robust decision of investment. There are numerous metrics included in gaining data linked to the company’s liabilities. The chosen corporation for this report is Barrat Developments Plc. The report calculates the dividend policy, WACC, DCF, Free Cash flows, forecasted share price, risk analysis and compares the price multiples of Barrat development with other competitors in the same sector. All the financial data has been gathered from Barrat development’s annual report and website and Bloomberg, Morningstar and Google Finance. To sum up the results, the DCF valuation, WACC measurement, and Barrat Developments’ investment analysis reveal that the CAPM is utilized to measure the equity cost. The risks are incorporated in the CAPM associated between the market price and that of Barrat Developments. The cost of equity is used as the dividend model’s growth, which can be implemented suitably to small firms. However, for bigger firms, the dividend growth model is not sufficient and does not need the risk of market comparison. Nevertheless, in Barrat developments, the risk is significantly and systematically inclined, so different capital costs are required to be chosen before making the investment decision. The DCF can be measured if different aspects can be shared, focusing on the share price fluctuations and the firm’s condition.
It is critical to have a detailed knowledge of the firm’s liabilities and debt as it is crucial to know the firm’s level of risk. A thorough understanding of these aspects will help in a robust decision of investment. There are numerous metrics included in gaining data linked to the company’s liabilities. The chosen corporation for this report is Barrat Developments Plc. The report calculates the dividend policy, WACC, DCF, Free Cash flows, forecasted share price, risk analysis and compares the price multiples of Barrat development with other competitors in the same sector. All the financial data has been gathered from the annual report and website of Barrat development and Bloomberg, Morningstar and Google Finance.
WACC calculation formula is;
Measurement of Debt Weights and Equity Weights
Barratt Developments current 2 years LTD was Million $ 122.7, and its obligation of the capital lease was $ Million 122.7. So, the book value of debt in total is 173.376 $ million (Google Finance, 2017).
Equity Cost (Ke)
CAPM is used to measure the equity cost Ke. A 10-year constant treasure maturity rate is used known as the risk-free rate. It is 1.24%. The beta for the firm is 0.54 (Google finance, 2017). So, equity cost is;
Ke = 1.24% + 6% * 0.54 = 4.48% (Bloomberg, 2017).
Debt Cost (Kd)
The past year’s Interest expenses divided by the current 2-year debt average leads to the debt cost. The interest expense for Barrat development as of 2017 was 60.69 Million $. The total Debt book value (D) is $ Million 173.376.
Kd = 60.69 Million / 173.376 million = 35.0056%.
Calculation of WACC
The current 2 years rate of an average of the tax rates is taken, which is 19.42%.
= 0.9779 X 0.0448 + 0.35006 X 0.0221 X (1-0.1942) = 5%
WACC = 5 % (Barratt Developments plc, 2017).
Explanation
WACC is a post-tax rate, and value from use should be calculated based on cash flows and pre-tax rates. Converting the rate after-tax to a pre-tax rate does not represent a simple increase in the rate after taxation, considering the effective tax rate; it may be necessary to consider other factors related to taxation, regardless of whether they are due to the occurrence of tax payments in the period for which the financial plan is drawn up and the cash flows are calculated; own WACC cannot be used as the discount rate in case the capital structure of the company is non-standard compared to typical participants of the market; WACC should reflect the risks inherent in the asset, and not the risks associated with the company as a whole, such as, for example, the risk of default. Barrat development’s WACC is the average rate determined for its business in its current state (Barratt Developments plc, 2017). These issues are discussed below.
From the financial point of view, real estate is a unique type of asset that simultaneously generates 2 types of income: the income from the growth of the asset’s capitalization, and the income from the monthly cash flow generated by such an asset. It is this circumstance that investment in real estate is fundamentally different from investing in portfolios of stocks, bonds and mutual funds that do not give a cash flow at the same time as the capitalization of the asset grows: one can fix profits from these investments only by selling part of its portfolio of stocks, bonds and mutual funds. In other words – either reducing your asset or selling it completely. Instead of such complex financial products with dubious profitability and high risks, we offer potential investors a fresh look at residential real estate (Wahlen, Baginski, and Bradshaw, 2014).
Talking only about the secondary housing market, all the traditional risks associated with investing in real estate at various stages of its construction are excluded. Secondly, when working with real estate, are focused not so much on the growth of the investment object’s capitalization but rather on the value of the monthly cash flow, its dynamics and maximization through professional operational management. This approach gives our investors many advantages (Ehrhardt & Brigham, 2016).
Investment opportunities of Barrat Development can be called one of the main criteria for choosing a dividend policy. Most companies almost constantly face finding financial sources for increasing production capacity, updating the material and technical base. In these cases, often resort to the practice of limiting dividend payments. Factors characterizing the investment opportunities of Barrat Development includes the stage of the company’s life cycle, the conjuncture cycle of the commodity market, to which the joint-stock company is a participant, the need for the company to expand its investment programs, the degree of readiness of investment projects planned for financing with a high level of efficiency (Vinten, 2013).
To determine the possibilities and sizes of dividend payments, it is necessary to forecast Barrat Development’s need for funds, which necessarily considers the company’s expected cash flows, the volume of investments, the possible increase in inventories and accounts receivable, the reduction of debts and other factors affecting the state of assets. The result of the forecast is to determine the timing and amount of future cash flows. Based on these calculations, you can determine whether the company will retain funds for dividend payments after financing all necessary expenses, including effective investment projects (Wahlen, Baginski, and Bradshaw, 2014).
In the absence of profitable investment opportunities, the shareholder will prefer not to expect effective future projects of the company but to receive higher dividends now for investing in other companies like Barrat developments competitors Berkeley group. Although there is no administrative, legislative regulation of the proportions of the distribution of net profit of enterprises, in the constitutive documents of many companies, the minimum share of the reporting year’s profit, which is mandatory for reinvestment, is specially stipulated.
Barrat development needs to maintain a sufficient level of liquidity. A prerequisite for deciding on dividend payments by Barrat development should be to ensure its assets’ sufficient liquidity level. Since the payment of dividends to Barrat development shareholders causes a reduction in its assets, the company must have enough assets in the form of cash on a settlement account or highly liquid assets free of obligations to pay dividends. By the date of payment of dividends, the joint-stock company should maximize the cash balance and highly liquid funds if possible (Wahlen, Baginski, and Bradshaw, 2014).
The liquidity of Barrat development is determined by its investment decisions, decisions on the degree of expansion of assets and on the identification of sources of funds to cover this need. Attracting external sources of funds for dividend payments, in addition to requiring additional costs, further reduces the liquidity of the company. Thus, an essential factor in limiting dividend payments is the need to maintain sufficient liquidity of companies. On the other hand, it is possible to maintain the existing liquidity level by paying dividends through an additional share issue (Titman, Keown, and Martin, 2015).
For the possibility of payment and the size of dividends, in addition to the received amount of profit, the level of return on equity is affected by the level of financial leverage. It depends on the ratio of own and borrowed capital developed by the moment of dividend payments (Wahlen, Baginski, and Bradshaw, 2014). Besides, if Barrat development can quickly obtain borrowed funds at the time of dividend payment, it can determine the size of dividend payments regardless of the degree of liquidity of its assets. Factors characterizing the possibility of forming financial resources of the company at the expense of external sources include:
On the other hand, the urgency of payments on previously received loans may lead to the impossibility of paying dividends since maintaining Barrat development’s creditworthiness is a higher priority than paying dividends. As already noted, shareholders’ aggregate income consists of two sources: dividend income and capital appreciation of the company. The increase in the share capital value depends on the dynamics of the market price of the company’s shares (Barratt Developments Annual Report, 2017). The share price growth is determined by many factors, including the company’s overall financial position in the capital market, goods, financial independence, profitability, and the level of dividend payments and its dynamics. By forming a dividend policy, the company’s management can affect the exchange value of its shares. If the market has alternative options for investing funds with a similar degree of risk but bringing a large rate of return on the invested capital, the company’s shareholders may require large dividend payments (Titman, Keown, and Martin, 2015).
An important factor affecting the company’s dividend policy is the threat of a possible loss of control over the company’s management. To maintain a stable level of dividend payments often resort to an additional issue of shares. Using an additional issue of shares as a source of coverage of dividend payments leads to the emergence of new shareholders and the company’s capital erosion. A low level of dividends can cause a decrease in the exchange value of shares and their mass discharge by shareholders, which in case of buying up securities by competitors will lead to loss of financial independence by Barrat development (Arnold, 2014).
Orders completed by our expert writers are

Barrat development tries to maintain stability in the dividend policy, as for many investors, managers, analysts, the dividend yield indicator is one of the main indicators of the company’s profitability. Failures in payment of dividends, any undesirable deviations from the established practice, can decrease the market price of shares and their mass discharge by shareholders (Titman, Keown, and Martin, 2015). Therefore, most companies seek to maintain a stable dividend policy in deteriorating market conditions and the absence of current profits. When conducting a dividend policy, the management of a joint-stock company is guided by the level of dividend payments from other companies equal to them in terms of size and scope of activity. A special place among the factors influencing the formation of dividend policy is the inflationary depreciation of assets. In the conditions of high inflation rates, the investor will prefer to receive today’s profits of the promised super profits tomorrow. It is difficult for a shareholder to refuse dividend payments to invest its profits even in high-yield projects (Arnold, 2014).
It is necessary to emphasize that each joint-stock company proceeds from its own conditions, problems, and values again in dividend policy. The extreme complexity of forming a dividend policy is associated with its multifactor and the lack of information to predict the long-term impact of the dividend policy being implemented on Barrat development’s market value.
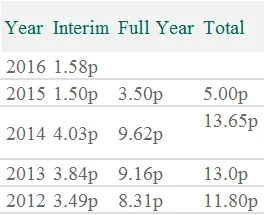
The above table reveals the pay-out of 5 years for Barrat development which shows that the current paid dividend was 1.58% which was the larger one compared to other years (Barratt Developments Annual Report, 2017).
Based on the calculations, the share price is calculated as £601 for Barrat Developments for the July 2018 period (Barratt Developments Annual Report, 2017).
The companies selected for comparison are Taylor Wimpey, Berkeley Group, Toll Brothers and Bellway group. The reason for selection is that all lies in the same sector, i.e., real estate residential property development. To explain why price multiples differ for competitors, the price/earnings multiplier concept needs to be precise. Price/earnings multipliers and price/cash flow are the most common way of determining the price since the company’s profit is valued. The company of analogues is the most accessible. As a financial base for the multiplier can be used any indicator of profit: net profit, profit before tax, profit before interest and taxes, etc. (Arnold, 2014).
The main condition of application is the conformity of the analogue’s financial base and the company being valued, i.e. the multiplier calculated based on gross profit (before interest and taxes) of the analogue company should be correlated with gross profit before interest and taxes of the company being valued. The price/earnings multiplier depends on the accounting system (GAAP); therefore, a foreign analogue company must bring profit-sharing systems to unified standards. Also, other adjustments may be required to obtain the identity of the conditions for calculating the profit required for the application of the multiplier. The financial basis for calculating the price/cash flow multiplier is the amount of cash flow based on the indicator of any profit and the amount of accrued depreciation (Ehrhardt & Brigham, 2016). Thus, several variants of the price/cash flow multiplier: the gross, balance sheet, net profit and depreciation.
Based on net profit, it is better to evaluate large enterprises that are in similar tax conditions. Based on profit before taxes – individual businesses and small companies, since in this case, the influence of differences in taxation is eliminated. The price/cash flow multiplier is preferable in evaluating asset-intensive enterprises with a large volume of non-current assets, loss-making, distressed enterprises with a small profit margin. The price/profit multiplier is used if the enterprise has a high specific weight of current assets or a high degree of depreciation of fixed assets (Ehrhardt & Brigham, 2016).
During 13 years, the highest yield of annual dividends for Barratt Developments was 9.23% (Bloomberg, 2017). The median was 5.09%, and the lowest was 1.60% (Bloomberg, 2016). As per Bloomberg (2017), the dividends per share for the past three months in 2016 were $0.94. The last year’s dividend growth for Barratt Developments was 6.70%. Contrasting with the 5 years period, the average dividend per growth of share was 6% ((Barratt Developments Annual reports, 2010- 2017). During the period of 13 years, the highest average per share rate of growth of Barratt Developments was 48.70% each year (Bloomberg, 2017). The ratio of dividend pay-out basically calculates the percentage of the firm’s profits being paid out as dividends (Ehrhardt & Brigham, 2016). The Pay-out ratio of Barratt Developments for 2014 is measured as;
The ratio of Dividend Pay-out= Dividends per Share/EPS (Ehrhardt & Brigham, 2016).
= 3.75/4.72
=0.79
The Pay-out ratio of Barratt Developments for 2016 is measured as;
=0.94 per share/0.34
=2.76 (Barratt Developments Annual Report, 2017).
The intrinsic value is measured from the model of DCF with parameters at default. In the DCF model, the future cash flows are calculated based on the rate of growth of the cash flow and the discount rate. The future cash flows are discounted to their present value at the rate of discount used. All the cash flow discounted is added to reach the present value (intrinsic) of Barrat developments (Arnold, 2014).
Normally, a two-stage model is utilized when measuring the value of intrinsic stock utilizing the model of DCF. The initial stage is known as the stage of growth; the second is known as the terminal stage. In the stage of growth, the firm grows at a rapid rate. As it cannot constantly grow at this rate, the lower rate is utilized for the terminal stage.
Based on the calculations, Barrat Development PLC’s intrinsic value is measured from the DCF model as $5.25. (Calculations are shown in the Excel sheet).
Cash Flow to Debt (total) Ratio = Cash Flow (Operating) / Total Debt (Ehrhardt & Brigham, 2016).
This ratio is a coverage ratio and contrasts the firm’s operating cash flow with its total debt. This ratio indicates the firm’s ability to cover the debt total with its annual operating cash flows—the more the ratio, the better its ability to carry out its debt obligations. The higher ratio shows that the company can recover from rough economic situations.
Over the time frame of three years past, the cash flow to total debt ratio has been inclining. The ratio has been inclined from 0.08329 in 2015 to 0.169 in 2017 (Barratt Developments Annual Report, 2017). As the ratio is more than 1, it shows that the firm can cover its overall debt with its annual operating cash flows. Based on the five ratios of debt, we can see that the company risk has declined over the past three years. The ratios show that its assets’ growth has become more than its liabilities and debt (Ehrhardt & Brigham, 2016).
The analysis of Barratt Developments’ share performance reveals that the firm has a robust history of growing and paying dividends. The company has a capitalization of $150 billion as of 2015 (Barratt Developments Annual Report, 2017). The corporation faced hardships lately due to the low natural gas and crude oil prices. The company’s stock price reached a high of $83 as of 2014 July but has recently fallen substantially. The share price is paying a present yearly yield of a dividend of 7.5% as of 2015 September, which is one of the sectors highest (Barratt Developments Annual Report, 2017). The stock price of Barratt Developments may have to fall further (Barratt Developments Annual Report, 2017)
Ratio of Debt to Equity = Total Liabilities / Stockholders Equity (Ehrhardt & Brigham, 2016).
The ratio of debt to equity is another ratio of leverage in the company’s corporate life cycle. This contrasts the firm’s total liabilities with that of its stockholder’s equity in total. This calculates how many lenders, suppliers, obligations and creditors the company has committed and what the shareholder has committed (Ehrhardt & Brigham, 2016).
A higher debt ratio to equity basically shows that the corporation has been aggressive in financing debt to grow. This can lead to the firm’s reporting of volatile earnings (Ehrhardt & Brigham, 2016). In basic, an inclined ratio implies that the firm may not accumulate enough cash to meet its debt obligations. Therefore, this is regarded as a riskier investment.
The beta calculated for Barrat developments is 0.80. This is less than 1, which shows that the first is slightly risky, and its price is lower than the volatility of the market (Barratt Developments Annual Report, 2017).
The past three years’ time frame of Barratt Developments shows that the ratio of debt to equity has declined. The ratio had dropped from 1.18 to 0.96. As the ratio is presently less than 1, this implies that stockholders have invested more than the lenders, suppliers, obligations and creditors. 0.96 portrays an average amount of company risk. As the ratio is less than 1, the company risk is moderately low.
To sum up the results, the DCF valuation, WACC measurement, and Barrat Developments’ investment analysis reveal that the CAPM is utilized to measure the equity cost. The risks are incorporated in the CAPM associated between the market price and Barrat Developments (Barratt Developments Annual Report, 2017). The cost of equity is used as the dividend model’s growth, which can be implemented suitably to small firms. However, for bigger firms, the dividend growth model is not sufficient and does not need the risk of market comparison (Barratt Developments Annual Report, 2017). Nevertheless, in Barrat developments, the risk is significantly and systematically inclined, so different capital costs are required to be chosen before making the investment decision. The DCF can be measured if different aspects can be shared, focusing on the share price fluctuations and the firm’s condition.
Arnold, G., 2014. Corporate financial management. Pearson Higher Ed.
Barratt Developments plc., (2017). Annual Report of Barratt Developments plc PLC.
Bloomberg. (, 2017). Wm. Barratt Developments plc. : Private Company Information – Bloomberg. [online] Bloomberg.com. Available at: http://www.bloomberg.com/research/stocks/private/snapshot.asp?privcapId=875491
Brealey, R.A., Myers, S.C., Allen, F. and Mohanty, P., 2012. Principles of corporate finance. Tata McGraw-Hill Education.
Brigham, E.F. and Ehrhardt, M.C., 2013. Financial management: Theory & practice. Cengage Learning.
Googlefinance.com. (, 2017). Barratt Developments plc. PLC: LON: MRW quotes & news – Google Finance. [online] Available at: https://www.google.com/finance?cid=7389304
Koh, A., Brigham, E.F. and Ehrhardt, M.C., 2014. Financial management: theory and practice. Singapore: Cengage Learning Asia Pte td.
Morningstar.com. (, 2017). MRW Barratt Developments plc. PLC XLON: MRW Stock Quote Price News. [online] Available at: http://beta.morningstar.com/stocks/XLON/MRW/quote.html
Titman, S., Keown, A.J. and Martin, J.D., 2015. Financial management: Principles and applications. Pearson.
Vinten, G., 2013. Investment Appraisal. A Managerial Approach. Managerial Auditing Journal.
Wahlen, J., Baginski, S. and Bradshaw, M., 2014. Financial reporting, financial statement analysis and valuation. Nelson Education.
If you are the original writer of this report and no longer wish to have it published on the www.ResearchProspect.com then please:
To write a master’s level academic report:

All work is written by human writers. 100% AI free, guaranteed.

100% money back guarantee if you find plagiarism in our work.
COMPANY DETAILS


