Disclaimer: This is not a sample of our professional work. The paper has been produced by a student. You can view samples of our work here. Opinions, suggestions, recommendations and results in this piece are those of the author and should not be taken as our company views.
Type of Academic Paper – Assignment
Academic Subject – Finance
Word Count – 3831 words
This research will present an overview of how to construct a Portfolio, download UK FTSE 100 stocks data for the last 11 years, and select 30 stocks data using the correlation analysis. It will be presented with investment opportunities and risks to consider the 30 stocks that will be chosen. To fulfil this goal, it will be analysed in detail the 30 stocks Portfolio using the Excel Sheet. The portfolio’s risk returns will be analysed based on 10-year performance using Markowitz Optimization & Traynor-Black strategies. After analysing the 10-year performance, the actual performance (abnormal returns) will be analysed for the last year. It is expected that this research and the calculations provided using an Excel sheet can contribute to an Optimum Portfolio risky assets and allow Investors to boost capital allocation, taking into consideration the risky portfolio and the risk-free asset. Based on the individual clients’ risk aversion and the relative return rates for the risky portfolio and the risk-free asset?
Primarily, this study will analyse a summary of the Investment Policy Statement of Miss I. Ohri, stating the objectives of her personal investment strategy and her future investment plans as well. Secondly, this study will put in the shade of constructing a Portfolio using UK FTSE 100 stocks and UK Government Bonds. Therefore, the investment benefits in FTSE 30 stocks will be critically analysed using the correlation analysis (Barberis, Mukherjee, & Wang, 2016). This will be done by looking at all the necessary information gathered (downloading share prices of UK FTSE 100 stocks data for the last 11 years). Furthermore, it will be analysed the Covariance, Correlation, Regression, and Descriptive Statistics of the constructed portfolio of 100 stocks, using Data – Data Analysis. It will also be analysed the 100 stocks Returns and Excess Returns. These calculations, especially the correlation analysis, will allow us to select the best 30 stocks from UK FTSE 100 stocks. Thirdly, it will be demonstrated how to calculate the Optimum Risky assets using the Markowitz Portfolio Optimization Model and the Traynor-Black Model and then will be assessed the portfolios’ returns, based on 10-year performance and in the end, will be analysed the concrete performance for the last year( Lasher,2013).
– What is an “Investment Policy Statement” – IPS?
An Investment Policy Statement (IPS) is a manuscript enlisted amongst a portfolio manager and a client who summarises broad-spectrum strategies. This declaration specifies the overall investment goalmouths and purposes of a client and defines the tactics that the manager would involve to meet these objectives. There is exclusive information on stuff such as asset allocation, risk tolerance, and liquidity necessities that are included in an IPS. (Investopedia, 2017). An example of an Investment Policy Statement will be described as follows:
Investment Policy Statement (IPS)
Client name: Iva Ohri
Status: (Single)
Age: 35
Retirement age: 65 years old
Address: 9 Stevenage Road, East Ham, London
Postal Code: E62AU
e-mail:
………………………………………………………………………………………………………………………………………
Investor Conditions
Due to the investors’ actual studies in MSc in Global Investments and Finance in London, actually, she isn’t interested in buying a new house. Still, she is interested in investing in other stocks, and the money saved should be managed consequently for 5 entire years (Andersen, & Glenn,2014).
The predictable position for the Investors’ economic condition:
Iva Ohri currently is living in London, following her studies. She is paying a monthly rent of £500. Her monthly expenses are approximately £850. Besides the money saved by her (approximately £7000), she owns another Albania savings account.
…………………………………………………………………………………………………………………………………………
Overview
The following facts are a summary of the Investor outline, created based on the evidence that she provided:
Investment Aims/Objectives
The Investor’s principal objective for the investment portfolio is to produce profits in London properties and achieve growth.
Investor’s Risk Tolerance: Traditional
Investment Time Horizon
She has acknowledged her portfolio’s investment time horizon to be 10 – 20 years.
The Methodology that will be used in this research will be a descriptive statistic and critical thinking of the calculations made with an Excel Sheet for calculating the Optimum Portfolio risky assets for UK FTSE 100 stocks. The proportion of an Individual Investor portfolio that should be invested at the risk-free asset portfolio and the risk-free asset (Bodie et al., 2014) will also be calculated.
How do we evaluate the Portfolio Performance of FTSE 100 stocks?
Firstly, we will download all the UK FTSE 100 stocks data for the last 11 years, and we will “copy” and “paste in the Excel Sheet all the FTSE 100 closing dates. Then, it will be calculated the returns of the portfolio for 11 years’ period. The standard deviation of the portfolio will be calculated, the portfolio returns, expected returns of the portfolio, the annual rate of each stock in the portfolio, the variance/ covariance matrix, annual variance, the annual standard deviation, and the weighted and the optimal risky portfolio. Below, it will be shown step by step calculations that have been used in the Excel Sheet so that you can have a better picture of the Optimum Portfolio.
Step 1:
Our Benchmark will be to divide the last year performance (2016), and then the ten-year performance will be shown together in the table. It will be calculated the holding period returns of 100 stocks, using the formula in Excel: So, we will convert the prices into returns using the formula:
Rt = LN (Pt/Pt-1);
In Excel Sheet, the formula must be: =LN(price today/price yesterday) and then auto-fill the column. For UK Gilt, for example, the formula that it will be used is =((1+(Data!B3/100))^(1/12))-1 because we want to exclude UK Gilt when constructing our portfolio. For FTSE 100, the formula for calculating the returns over the 10 year period is: =LN(Data!C3/Data!C4)
Step 2:
How to find the covariance and variance for 100 stocks?
It will find it running Data – Data Analysis – Selecting Covariance and then select all the data with the returns for 100 stocks and then run ok. We will also do the same thing for finding the Variance of 100 stocks ‘returns Portfolio, running Data – Data Analysis -Selecting Variance, and then select all the Returns data of 100 stocks and then press ok. Correlation means how all the 100 stocks’ returns occur simultaneously. We also need to find the regression of our portfolio running Data – Data Analysis – Regression – select all the Returns data of 100 stocks and then press ok.
Step 3:
We have to choose 30 stocks, based on the correlation and alpha. To create an Active Portfolio, the correlation has to be lower enough. Below it will be shown the 30 stocks based on the lowest correlations:
(30 Stocks Portfolio)
| Ashtead Group |
| RBS |
| Aviva |
| Barrat Developments |
| GSK |
| British American Tabacco |
| IMB |
| ITV |
| Persimmon |
| Taylor Wimpey |
| Wolesley |
| Randgold |
| HMSO |
| IAG |
| British Land |
| Carnival Corporation & plc |
| Easyjet |
| BT Group |
| Informa |
| 3i |
| London Stock Exchange Group PLC |
| Marks & Spenser Group PLC |
| Sage Group |
| Travis Perkins |
| RELX |
| Old Mutual |
| KGF |
| DCC |
| Intu |
| Legal & General Group PLC |
Step 4:
After choosing the 30 Stocks Portfolio, it will be demonstrated how to calculate the Optimum Portfolio risky assets, using Excel. It will be shown the Portfolio Optimization of 30 Stocks portfolio using the Markowitz Portfolio Optimization Model. This Portfolio theory explains how each of the 30 stocks in a portfolio relates respectively with each other, and it tries to find to reduce the risk, whereas optimising returns. What is important to consider in this Model is that we will look for the Optimal Portfolio, which will give us the best risk-return trade-off. That will lie along this minimum variance frontier within a given of risky assets.
In the Excel Sheet, It will be looked at 30 different stocks that we have already chosen, and we are going to combine those in the best weights, to give us that risk-return trade-off that produces the optimal outcome. So, the Expected Return for a portfolio is calculated as the weights of the assets within the portfolio multiplied by their Expected Return (Portfolio Optimization Youtube, 2017):
E(rp) = ∑ W1 E (ri)
The variance of two assets (X and Y) portfolio is calculated as: (the weight of “X” squared, multiplied by the variance of X squared, plus the weight of “Y” squared multiplied by the variance of Y, plus two times the weight of “X” multiplied by the weight of “Y”, multiplied by the covariance of X and Y or how they move together. If we generalise this formula to more than 2 assets, we can use the following equation: the sum of the weights multiplied together for each asset “I” and “j” multiplied by the covariance. The Expected Return for the Portfolio is calculated using matrix notation, where we have the weights of the assets of our Portfolio transposed multiplied by their expected return, where: W – is the vector of weights of the individual assets (i through j) in Portfolio and R – is the vector of expected returns on the individual assets (i though j) in the portfolio. The Formula in Excel that will be used is:
{=mmult(transpose(W),R)}
Where W – is the Column of Weights and R- is the Column of Expected Returns. When we make calculations with arrays in Excel, type in the formula, but don’t press Enter. Instead, we have to hold down [Ctrl] [Shift] and then press [Enter]. This will tell Excel that we are making calculations with an array put the curly parentheses around the formula.
The Portfolio Variance is calculated as the weights of each asset in the Portfolio transposed multiplied by S, where “S” is the variance/covariance matrix and then multiplied again by the assets’ weights in the Portfolio.
The Portfolio’s Standard Deviation will be calculated as the square root of the Portfolio variance. The Standard Deviation of the returns of the Portfolio is calculated in Excel as:
{=sqrt(multi(multi(transpose(W),S),W))) and then Press [CTRL, SHIFT together and then press [Enter]]
The Optimal weights of the 30 Stocks in our Portfolio are the ones that maximise the value of the sharp ratio for the Portfolio, and it will be shown using “Solver” in Excel to do this.
The optimal mix of weights for the assets in our risky portfolio is the mix that creates a portfolio along the efficient frontier that is tangent with the capital allocation. This results in the capital allocation with the largest slope (sharp ratio) and is, therefore, the optimal risky portfolio.
Orders completed by our expert writers are

We will choose those stocks with a higher Sharp ratio, and the Risk-free rate will assume that it will be 1,07.
| The Complete Portfolio |
| Risky portfolio | Gilt | Complete Portfolio |
| 12.00% | 1.07% | 16.62% |
| 14.52% | 0 | 20.66% |
| 4 | Sharpe | |
| 142.27% | -42.27% | 0.7527 |
Our Sharp ratio will be calculated in Excel as =(Expected Return – Risk-free rate)/Standard Deviation of the Portfolio.
So, the highest Sharp ratio in our 30 Stocks Portfolio is 0,752. And our Expected Return Portfolio is 12% with a Standard Deviation of 14, 52%.
Our Optimal Weight in our Risky Portfolio is 142.27%, with a risk aversion of 4.
If we look at our Complete Portfolio, our Expected Return is 16.62% with a Standard Deviation of 20, 66% (that is the measure of risk in our Portfolio), and with an Optimal weight of 0.7527.
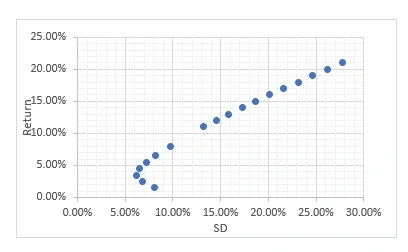
The portfolio we can find in the graph below. The golden rule is that an Investor can take more risk investing in these 30 stocks only if they can that higher level of return. And similarly, Investors can get a higher level of return if they are willing to take that extra risk (Mangram, 2013). No one of the Investors should invest below the 5% expected return because it will increase the returns while decreasing risk (Markowitz, 2014). So, the graph shows that the lower the risk in a portfolio, the higher return. Investors should be interested in an efficient portfolio, which means a portfolio where the relationship between risk and return is such that we can get a higher return only by taking a little extra risk. And the investor should be interested in taking all this little extra risk because it should bring a higher return (Markowitz, 2014). We want to know where the inefficient frontier end and the efficient portfolio start to do. It will be the point on the graph below, where the Standard Deviation is the lowest (the lowest risky portfolio). We call this the Minimum Variance Portfolio (Mangram, 2013).
This model is thought to present low-return, low-risk stocks comparing with those with
The benefits of portfolio planning with the efficient frontier or the advantages of using the “Markowitz Optimization Model” , are wherever a portfolio’s risk and return and converted by the efficient frontier. The efficient frontier is an arched line that lies down in a graph with expected portfolio return on the “y” axis and the portfolio’s standard deviation (or risk) on the “x” axis. The Markowitz Optimization Model called the Modern Portfolio Theory is a methodology for portfolio investing, where the complete market and economy are investigated or analysed. This theory was developed by Harry Markowitz (that is called the “father of portfolio management” (Wallengren, & Sigurdson, 2017)
. This Portfolio Theory explains how each stock in a portfolio relates respectively with each other, and it tries to find to diminish risk, whereas optimising returns. Model Portfolio Theory considers the revenues of collateral and its systematic and unsystematic risk (Mangram, 2013). So, it considers the whole return and risk of a portfolio consisting of specific collaterals, and it designs a line with completely the presented portfolio opportunities (Dhrymes, 2017). This line is recognised as an efficient frontier. The portfolio can accomplish better with a minimum quantity of risk is based on risk, and in return, a portfolio can move closer to the efficient frontier. To boost or optimise the risk and return, it is significant to invest in a portfolio that is on or lies down nearby to the efficient frontier. Everything underneath the efficient frontier yields requires too much risk for the expected return (Investopedia, 2017).
The “Treynor-Black Model” is a sort of asset allocation model established by Jack Treynor and Fischer Black. The model makes an effort to find out the optimal mixture of inactively and dynamically accomplished stocks in an investment portfolio. As soon as shaping the optimal allocation of stocks, the model concentrates mainly on stocks’ systematic and unsystematic risk (Gerber, Markowitz, & Pujara, 2015).
The disadvantage of using the Treynor-Black Model is that a specific individual can realise that the model concentrates less on the “Beta” of stock and its unsystematic risk. If a stock has more unsystematic risk, at that point, it is not given not as much weight in the Treynor-Black Model (Gerber, Markowitz,& Pujara, 2015). As a consequence of this trend, this model is thought to present low-return, low-risk stocks compared with those with high-level returns and greater risk (Investopedia, 2017).
The portfolio risk-return profile analysis is evaluated using the applicable model based on the 10-year performances and the abnormal returns for the previous year. Treynor-Black Model analyses the dimensional active investment as well as the asset allocation and market portfolio. The model is based on the fundamental assumptions that make the data apply; otherwise, it would be invalid. For instance, security analysts are involved in the organisation’s active management and analyses the small number of stock’s depth for the entire universe of securities (Brown, 2015).
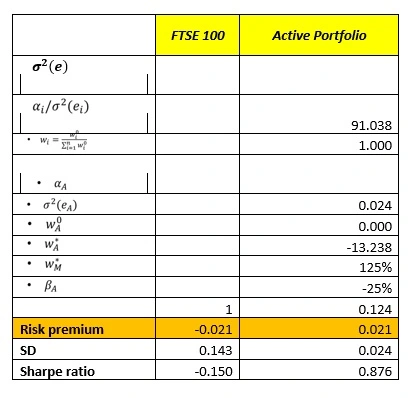
Treynor’s measure compares portfolios based on the alpha-to-beta ratio. The alpha of the FTSE security portfolio forecasted is 0, whereas the risk premium was -0.214, and the standard deviation of the portfolio stock is 0.1425. On the other hand, for the optimal risky portfolios, the premium’s values, standard deviation changes, and values of the Sharpe’s ratio. The values for the stock parameters’ changes with a beta of 1, risk premium of -0.021 standard deviation of 0.143 and -0.150.
Sharpe’s philosophy involves the regression of the portfolio returns on indices representing a broad range of the assets clauses. Therefore, each index’s regression coefficient will assess the fund’s implicit allocation since the funds are restricted; the regression coefficients will be constrained to zero or positive and to an equivalent of 100 to have a complete asset allocation (Imai, Van Deventer, & Mesler, 2013). Since alpha is zero, it is worthless to move away from the passive strategy. The index portfolio would solely depend on the managers’ choice of action, but this is a far-fetched possibility. Therefore, to determine the effect of the security purchase over the other involves the assessment of the Markowitz models that evaluate the risk, returns and diversify the portfolio combination to neutralise the effect of the risk through diversification (Yang, & Yeh, 2015)
The assessment of the portfolio performance and effective rebalancing based on the remedial action involves applying the Markowitz model whereby the investor can determine the trade-off between risks and return ranging from zero to infinity. In this case, it is evident from the 100FTSE stock portfolio (Guerard, 2016). The mean return for the portfolio stock need to be computed to determine using the weights of the respective portfolio (See FTSE 100 calculation)
Based on the attached values the expected portfolio returns is computed by a*Ba+WbBb+…n =125%*0.124 +-25%*0.024 =0.155-0.006 =0.149.The evaluation of the portfolio’s risky nature involves assessing the beta stock of the portfolio and its implication to the investor. The optimal combination of the active portfolio with the passive portfolio takes off from the construction of an optimal risky portfolio from two risky assets that were evaluated by applying the Sharpe’s ratio (Brigham, & Ehrhardt, 2013).
The active portfolio is perfectly correlated with the index require diversification that involves mixing it with the index, which is likely to yield higher returns. The active management’s success and the contribution of the active portfolio by the Sharpe ratio and the risky portfolio compared to the index portfolio (Brown, 2015). Thus, the FTSE 100 portfolio stock assessment indicates that diversification is the only available option to reduce the impact of the risk in the market scenario.
The stock portfolio’s performance based on the FTSE market index indicates that nearly the beta of the portfolio ranges from 0.1-0.8 this indicates the risk aspect of the individual portfolio but the values reduce when diversified as evident in the combinations of their portfolios standard deviation. The implication of the portfolio’s stock of the respective stock is analysed by the corresponding alpha, beta, risk premium, and standard deviation parameters showing that approximately 10percent of the stock are less risky. Approximately 40% are average, whereas 50 per cent of the stocks are hazardous, which means that the diversification method will reduce the risks.
If you are the original writer of this Assignment and no longer wish to have it published on www.ResearchProspect.com then please:
To write an undergraduate assignment:

All work is written by human writers. 100% AI free, guaranteed.

100% money back guarantee if you find plagiarism in our work.
COMPANY DETAILS


