Here is a sample that showcases why we are one of the world’s leading academic writing firms. This assignment was created by one of our expert academic writers and demonstrated the highest academic quality. Place your order today to achieve academic greatness.
Since 1990, the global rate of obesity has more than doubled, with a third of the earth’s population being categorized as severely obese. Obesity harms nearly all physical and social systems of the human life and is a substantial public well-being problem. It raises the chance of acquiring a variety of medical issues, including hypertension, heart disease, numerous forms of cancer, a variety of orthopedic illnesses, and psychological problems, all of which have an adverse impact on way of life, job efficiency, and general expenditures (Romain et al., 2018).
The health expenditures spent by a single obese individual in the US were projected to be US$1801 per year in 2016, inducing to USD 150b at the state level. The overall economic costs of overweight and obesity in Europe were comparable to 0.46–0.62 percent of GDP (Okunogbe et al., 2021).
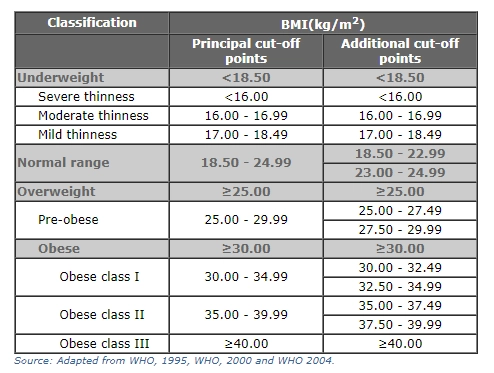
Obesity is described by the World Health Organization (2016) as irregular or unnecessary fat buildups that pose a health threat. The body mass index (BMI) is a fundamental statistic used to determine total body obesity. It is computed by dividing the body weight in kilograms by the square of height in meters. Current Centers for Disease Control and Prevention (CDC) and World Health Organization (WHO) standards describe a healthy BMI range for individuals as 18.5 to 24.9. Still, a BMI of 25 kg/m2 is considered fat, a BMI of 30 kg/m2 is overweight, and a BMI of 40 kg/m2 is categorized as severely obese.
Obesity, despite this too simplified description, is a complex condition caused by a persistent healthy individual, i.e., when daily nutrient consumption surpasses calorie expenditure (Purnell, 2018). Excessive energy is transformed to lipid, kept in adipose tissue depots, which grow in magnitude, making body obese and promoting mass gain.
The global food chain produces an excessive treated and inexpensive food which promotes passive excess consumption of energy-concentrated, nutrient-impoverished foods, and drinks, has been recognized as a primary factor of the obesity crisis. However, a reduction in physical activity due to the transformation of lifestyle choices is also prospective to be a factor (Khor et al., 2020).
Obesity can grow at any stage. Preceding studies examining obesity tendencies discovered that its occurrence has grown in adults and children of all ages, irrespective of physical boundaries, social background, or socio-economic level. Obesity is more widespread in poor nations among middle-aged people from affluent and urban areas; it affects both sexes and ages in rich countries, although its incidence is unevenly higher among poor populations (Backholer et al., 2014). In this essay, I review the occurrence rates and modern trends of overweight and obesity in adults, social determinates of obesity, and policies to reduce obesity on a global scale and especially in the UK.
Obesity is a complicated illness with several causes. Since 1990, the global prevalence of obesity has more than quadrupled, with a quarter of the world’s population being categorized as overweight or obese. Obesity numbers have risen beyond all age groups and sex, regardless of geographical boundry, race, and socio-economic status (Backholer et al., 2014).
Obesity, on the other hand, is more common among older adults and females. Its propensity was steady across areas and countries, in spite of significant disparities in absolute incidence rates of obesity. For some developed countries, the prevalence rates of obesity seem to have leveled off during the past few years (Amin et al., 2021).
And in the newest 2010-2019 audit issued by Cancer Research UK (2019), 64% of UK grownups, ages 19 years and beyond, are obese. It embodies roughly 36m grownups in the UK who have excessive mass. Additionally, the country is handling a significant public health catastrophe. Around 21,899 heart and vascular demises are attributed to excess mass and obesity every year, according to a 2020 article issued by the UK Heart Organization.
Due to the distressing rise in obesity in the UK, GlobalData epidemiologists (2020) estimate that the identified incident cases of hospitalization for congestive heart failure (CHF) will likely continue to increase over the coming six to eight years. Therefore, it is crucial to investigate obesity to find its determinants, socio-economic impacts, and policies to curtail it.
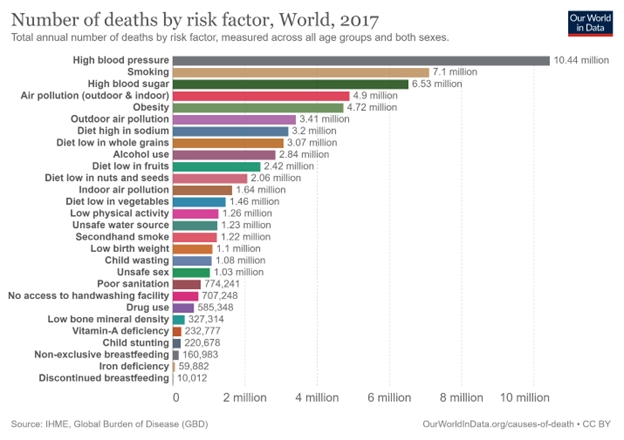
Obesity is one of the most serious well-being global issues, and it has changed from being a concern in developed states to one that affects people of all economic backgrounds. The Universal Burden of Ailment is ample international research published in the medical magazine The Lancet on the reasons and risk element for death and illness.
These estimations of the yearly number of fatalities caused by a variety of risk factors are shown below. This graph displays the worldwide total, but it can be viewed using the “change country” button for any nation or area. Obesity, characterized as a high BMI, is a risk element for several of the world’s leading causes of mortality, including cardiovascular disease, dementia, hypertension, and several forms of cancer.
Obesity does not explicitly cause any of these health effects, but it does raise the risk of developing. According to the graph, it is one of the leading causes of mortality worldwide. Obesity killed 4.8 million people prematurely in 2017, according to the Global Burden of Disease research. To place this in context, this was over five times the number of people killed in car crashes and almost double the number of people killed by HIV/AIDS in 2017 (Ritchie and Roser, 2017).
In 2017, 2 billion and 608 million individuals were predicted to be overweight or obese globally, representing nearly 40% of the world’s population. And the global incidence rate of adult obesity in 2017, by age category, for men and women aged twenty years. In 2017, the incidence of obesity was slightly lower than that of men than in males among young adults (aged 20 to 44 years), but this tendency reverted after age 45–50 years, possibly due to puberty in females (Friedrich, 2017).
Obesity rates were usually more excellent in women than males across all age categories, with sex disparities peaking between 50 and 65. Overweight and obesity rates grew with age, beginning at 20, peaked between 50 and 65, and then fell somewhat. Overweight prevalence rose from 37 percent in 1990 to 50.33 percent in 2017, suggesting an almost 50 percent raise over the previous 35 years.
Obesity prevalence increased from 8% in 1990 to 13.5 percent in 2017, showing a nearly 90% rise. All through this era, the prevalence rates of overweight and obesity were consistently higher in females than males; a tendency of declining sex differences in recent years was seen for overweight, while sex disparities in obesity stayed impressively stable (Friedrich, 2017).
The two areas with the greatest epidemic of obesity were the US and UK. Overweight prevalence climbed from 47.3 percent in 1990 to 65.2 percent in 2017, while obesity prevalence amplified from 14.9% in 1990 to 29.3% in 2017. The US and Mexico have the highest incidence of overweight and obesity. Overweight prevalence climbed from 50% in 1990 to 69.6% in 2017, and obesity prevalence amplified from 15.6% in 1990 to 23.9% in 2017 (Friedrich, 2017).
Overweight and obesity prevalence rates were relatively constant among nations within each one of these two zones. In 2017, Germany and the US had the greatest prevalence estimates of overweight and obesity in the European and American areas, respectively, while France and Brazil had the lowest. Obesity prevalence climbed from 38.9 percent in 1990 to 50.6 percent in 2017, while obesity prevalence amplified from 12.8 percent in 1990 to 20.6 percent in 2019. From 1990 to 2020, most overweight and obesity in the African area doubled, rising from 19.5 percent to 35.5 percent and 7.2 percent to 13.7 percent, respectively (Huizar, et al., 2021).
In the Mediterranean Basin and African areas, the prevalence rates of overweight and obesity vary significantly between nations. For example, the prevalence of overweight in Iraq stayed relatively stable yet high (from 63.6 percent in 1990 to 67.6 percent in 2019), but in Pakistan, it climbed from 25.1 percent in 1990 to 36.4 percent in 2017.
Likewise, the prevalence of overweight grew in South Africa from 50.4 percent in 1990 to 60.8 percent in 2018, while it climbed in Ethiopia from 7.1 percent in 1980 to 15.9 percent in 2015. Overweight and obesity trends have also grown in the West Pacific area over the last 35 years, even though prevalence rates are the lowest internationally.
The overweight proportion climbed from 9.9 percent in 1990 to 29.2 percent in 2018, while obesity prevalence increased from 0.9 percent in 1990 to 5.9 percent in 2015. Overweight prevalence in China, for example, nearly quadrupled from 8.8 percent to 30.9 percent. In the southeast Asian area, the majority of overweight climbed from 11.9 percent in 1990 to 25.3 percent in 2020, while the prevalence of obesity went from 1.8 percent in 1990 to 7.2 percent in 2015.
Overall, despite a 5–7-fold variation in absolute incidence rates of overweight and obesity among areas, the growing trend remained consistent across all regions during the previous 35 years, with signs of a flattening off in some but not all areas (Huizar, et al., 2021).
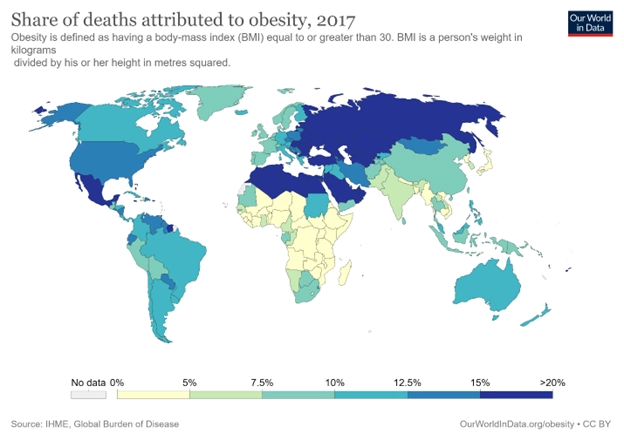
Furthermore, obesity account for 9% of mortalities worldwide in 2017, increasing 5.6 percent in 1990. This proportion varies significantly across the globe. They may see the percentage of deaths caused by obesity in different nations on this map. Obesity caused more than 16% of mortality in several poor countries in 2017, notably in Northern Europe, South Asia, South Africa, and Latin America.
It is most probably due to a high incidence of obesity but weaker general healthcare systems than high-income nations with equally high levels of obesity. In most rich nations, this proportion is between 9 and 11%. It is almost half of what many middle-income nations have. Asian countries are notable outliers among prosperous nations, with obesity accounting for just about 5% of premature mortality. Obesity is responsible for less than 7% of death in poor countries, particularly Sub-Saharan Africa (Ritchie and Roser, 2017).
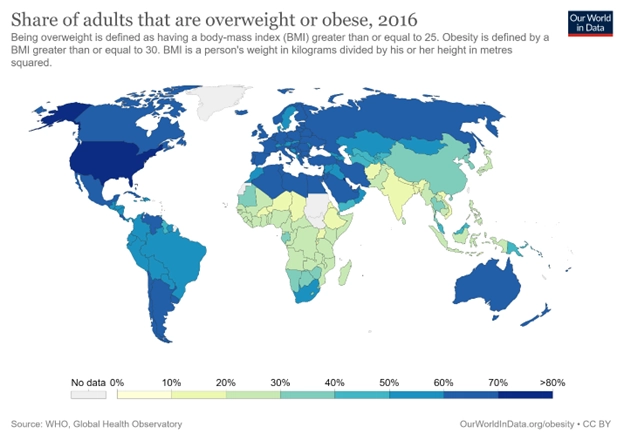
Similarly, 40 percent of persons aged 19 and beyond worldwide had high BMI in 2016. That’s obesity is also defined by BMI: the threshold number is lesser than obese people, with a BMI of 25 or above. On the map, one can see the % of adults who are obese in each country. The general tendency is relatively similar to the worldwide spread of obesity: overweight persons are more significant in wealthy nations and lower in poorer countries.
Of course, the balance of fat people is far more significant than the proportion who are obese. Approximately two-thirds of adults in most high-income nations are overweight or obese. In the United States, 75% are. At the lower side of the spread, around one in every five persons in South Asia and Sub-Saharan Africa has a BMI greater than 25 (Ritchie and Roser, 2017).
Orders completed by our expert writers are

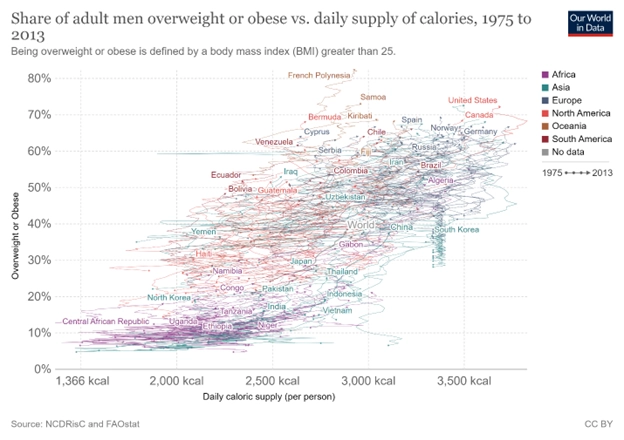
And the global supply of calories has grown over the last century, especially during the previous fifty years. In the mid-1950s, the average world supply of calories (the number of calories available for consumption) was 2300kcal per person per day. It has risen to 2900kcal by 2013. As a result, energy consumption has been increased in the majority of other countries.
If an increase in energy expenditure does not accompany this surge, weight gain and increased obesity rates will occur. The graph depicts the association between the proportion of males who are overweight or obese (on the dependent axis) and the average daily supply of kilocalories per individual. Overall, we detect a clear direct relationship: nations with a higher prevalence of obesity have a greater supply of calories (Ritchie and Roser, 2017).
A research was carried out to measure the association between long-term monetary stress and eventual obesity. The household income and labor dynamics Australia survey was used to obtain data for this study. This survey includes a self-completion assessment and a face-to-face interview in which participants were asked about their income, health, well-being, and job.
This study was undertaken for three years in succession. Following this Australian investigation, the scientists found a relationship between chronic monetary stress and later obesity. People who indicated being financially stressed in three successive year questionnaires were more likely to be fat the following year. Other significant factors, as well as initial obesity, were adjusted before the survey.
After correcting the baseline, the connection between self-reported well-being, physical exercise, drinking, psychological health, age, relationship status, race, and salary vanished. Still, the correlation with financial stress remained constant. According to the findings of this study, the relationship between financial pressure and obesity might be due to both physiological and behavioral factors.
Tension has been connected to eating extremely delicious meals, being heavy in fat and sugar, and obesity. While physically, stress increases hypothalamus-pituitary function, which is followed by metabolic disorders associated with weight gain. Future studies can look at behavioral aspects, including food consumption and the relationship between financial stress and obesity, to help avoid obesity. The researchers also revealed that the relationship between obesity and monetary pressure was distinct to psychological health (Siahpush et al., 2014).
A research was undertaken to see if females who acquire symptoms of PTSD are more likely to become obese or chubby than women who do not experience posttraumatic stress symptoms. In addition, to see if the effects are irrespective of anxiety. In 1990, a subset of the Nurses’ Health Investigation II aged thirty to forty-four years old participated in this study.
A 2007 follow-up study in which trauma and Posttraumatic stress were assessed. According to the findings of this study, females who had at least five or more PTSD signs before 1990 had a higher body mass index throughout the follow-up period. While the women who experienced PTSD symptoms in 1990 or after had the same body mass index as before the start of PTSD.
The emergence of four or more PTSD signs in 1990 or later was associated with an elevated chance of becoming overweight or obese among women with normal BMI; the findings remained consistent after controlling for depression. In summary, this study found that women with PTSD had a higher weight gain and obesity rate than women who had no stress or PTSD symptoms.
Women who first had PTSD symptoms before 1989 had a higher BMI at each follow-up study evaluation, and it grew quicker. This study had several advantages, including large sample size, BMI before and after the beginning of PTSD symptoms, and comprehensive data on possible confounders (Masodkar et al., 2016).
A study was carried out to investigate the association between marital status, obesity, and bone structure. This study’s sample contained information from the 1996 McArthur National Study of Middle age Development in the US (MIDUS). The sample consisted of non-institutionalized British persons aged 25 to 74 with functional phones. The majority of those chosen were married, with men being more likely than females and less likely to be parted or divorced. Men married for second years later than women in the cohort (Mukhopadhyay, 2008).
On the other hand, females were more likely to get divorced, be separated for long periods, and be bereaved at some point. According to this study, married people weighed more than separated or divorced men but not more than never-married men. Nevertheless, it was shown that married people had the same body mass as divorced or separated women.
Women who had never married had a higher BMI and were more likely to be obese than married couples. After twenty-one, males and females in a live-in relationship acquired less weight than their married counterparts. The results suggest that other reasons in the reported correlations between female, marital, and body mass remain unknown (Sobal and Hanson, 2011).
A research was conducted to investigate the correlation between obesity and health literacy among Pacific Islanders and Hawaiians in the US. Individuals from Hawaii and Utah were included in the study. The newest vital signs’ health literacy technique was employed; demographic questions, weights, and heights were measured.
According to the findings of this study, 46.3 percent of participants had a high risk of having inadequate health literacy. Lower scores were associated with a greater BMI, whereas higher scores were associated with higher education and income. Women performed much better than males; however, there was no statistically significant difference between participants’ scores in Hawaii and Utah (Cheng et al., 2018).
In addition, another research was undertaken to see if views, opinions, and nutrition knowledge were associated with obesity among low-income African-American and Hispanic women caregivers. The survey found that Hispanics had fair awareness of nutrition, whereas most Blacks had high knowledge. The calculated understanding, emotions, and attitudes rating had no significant relationship with the individuals’ weight status or diet quality.
However, perspectives and ideas about healthy eating were highly associated with dietary intake and weight among Hispanics. The most common barrier to eating healthy meals among both categories was the cost of nutritious foods (Chari et al., 2014).
In order to fight the obesity pandemic, communal activities should give emphasis on encouraging healthy food and physical activity in various settings and different initiatives that may be applied in early childhood care, clinics, universities, and restaurant services (AlMarzooqi and Nagy, 2011).
To help revert the obesity crisis, schools should indorse healthy food and physical activity throughout the school day (AlMarzooqi and Nagy, 2011).
According to Buscemi et al. (2015), because most young children spend time in care outside of their homes, the ECE environment is one of the most delicate areas to target young children with obesity prevention programs. Every week, an estimated 74% of children ages 3 – 7 who are not yet in kindergarten are non-parental care.
ECE centers serve as the primary weekly care arrangement for more than 6 million newborns to five who are not yet enrolled in kindergarten. Children aged newborn to three years old who attend ECE centers spend an average of 30 hours a week there. State ECE systems can encourage diet, baby feeding, physical exercise, and screen time restrictions.
Practices and programs that promote healthy nutrition and physical exercise among young children can be implemented in ECE facilities. These enhancements may directly impact what kids consume, how active they are, how much screen time they spend, how mothers who breastfeed are supported, and how a framework for healthy living is built.
According to Gómez (2015), Safe Approaches to School, a project that encourages active transportation to schools by developing bike lanes, trails, and walkways, received $185 million in national funding in 2009. Let’s Move! a program established by First Lady Mrs. Obama in 2010, aims to improve school food conditions, promote opportunities for physical exercise, and boost the accessibility and availability of nutritious meals.
The Nutritious Food Funding Project, introduced in 2010, aims to enhance access to healthy foods by bringing supermarkets to areas absent. The Healthier, Hunger-Free Children Act of 2010 empowered the US Department of Agriculture to control the availability and quality of meals sold to school-aged children. As part of the Patient Protection and Affordable Care Act, federal menu labeling laws were approved in 2010.
The efficacy of these adjustments is difficult to assess; techniques for measuring environmental changes and connecting them to individual behavior and population health are currently being developed. Evidence shows that policies to enhance safe routes to school may encourage more walking or bicycling, but this shift has not been linked to changes in body weight. Menu labeling initiatives have shown mixed outcomes. At the same time, it is unclear if menu labeling significantly influences the number of calories ordered. There is some indication that customers may take fewer calories later in the day.
Similarly, according to Theis and White (2021), because of the continuing COVID-19 epidemic, the UK Administration launched the Better Health campaign in August 2020 to fight overweight and obesity. This free weight reduction strategy promotes healthier eating habits and a more active lifestyle, but it isn’t accurate. The promotion emphasizes calorie restriction and choosing better choices grounded on calorie content.
However, this is oversimplified. Calorie restriction is not the sole step required to promote health. In its place, greater emphasis should be placed on teaching people what defines a stable diet, particularly one rich in a variety of vegetables and whole grains, as well as healthy fats and proteins. Some years ago, the UK government imposed a tariff on sugar-sweetened soft drinks, and other nations followed suit.
This strategy appears to work since the amount of sugar sold in beverages per capita has decreased since the charge was implemented. Could the government not launch similar campaigns for other compounds proven to be harmful? Forced to subsidize vegetables and fruits would also make these commodities more accessible to a broader range of consumers (Bleich and Ard, 2021).
This essay presented a comprehensive overview of the obesity epidemic around the globe. Firstly, it defined obesity according to the WHO standards. After that, it gave a broad view of epidemiological data on obesity around the world. Then it identified the social determinants of obesity such as financial stress, marriage, health literacy, etc. Lastly, it reviewed the policies and interventions to curb obesity around the world. In conclusion, this report gave a brief but comprehensive overview of obesity around the world.
AlMarzooqi, M. & Nagy, M., 2011. Childhood obesity intervention programs: a systematic review. Life Science Journal, 8(4), pp. 45-60.
Amin, M. et al., 2021. Obesity, a major risk factor for immunity and severe outcomes of COVID-19. Bioscience Reports, 41(8).
Backholer, K. et al., 2014. A framework for evaluating the impact of obesity prevention strategies on socioeconomic inequalities in weight. American journal of public health, 104(10).
Bleich, S. & Ard, J., 2021. COVID-19, obesity, and structural racism: Understanding the past and identifying solutions for the future. Cell metabolism.
Buscemi, J. et al., 2015. Society of Behavioral Medicine position statement: early care and education (ECE) policies can impact obesity prevention among preschool-aged children. Translational behavioral medicine, 5(1), pp. 122-125.
Cancer Research UK, 2019. Overweight and obesity statistics. [Online]
Available at: https://www.cancerresearchuk.org/health-professional/cancer-statistics/risk/overweight-and-obesity
Chari, R. et al., 2014. Association between health literacy and child and adolescent obesity. Patient education and counseling, 94(1), pp. 61-66.
Cheng, Y. S. J. H. H. L. Y. et al., 2018. High health literacy is associated with less obesity and lower Framingham risk score: Sub-study of the VGH-HEALTHCAR trial. PloS one, 13(3), p. e0194813.
Friedrich, M., 2017. Global obesity epidemic worsening. Jama, 318(7), pp. 603-603.
GlobalData, 2020. Social media posts about links between obesity, diet and COVID-19 by metabolic disorders influencers peaked in May, says GlobalData. [Online]
Available at: https://www.globaldata.com/social-media-posts-about-links-between-obesity-diet-and-covid-19-by-metabolic-disorders-influencers-peaked-in-may-says-globaldata/
Gómez, E., 2015. Understanding the United States and Brazil’s response to obesity: institutional conversion, policy reform, and the lessons learned. Globalization and health, 11(1), pp. 1-14.
Huizar, M., Arena, R. & Laddu, D., 2021. The global food syndemic: The impact of food insecurity, Malnutrition and obesity on the healthspan amid the COVID-19 pandemic. Progress in cardiovascular diseases, Volume 64, p. 105.
Khor, E. et al., 2020. Obesity definitions in sarcopenic obesity: differences in prevalence, agreement and association with muscle function. The Journal of frailty & aging, 9(1), pp. 37-43.
Masodkar, K., Johnson, J. & Peterson, M., 2016. A review of posttraumatic stress disorder and obesity: exploring the link. The primary care companion for CNS disorders, 18(1).
Mukhopadhyay, S., 2008. Do women value marriage more? The effect of obesity on cohabitation and marriage in the USA. Review of Economics of the Household, 6(2), pp. 111-126.
Okunogbe, A. et al., 2021. Economic impacts of overweight and obesity: current and future estimates for eight countries. BMJ global health, 6(10), p. e006351.
Purnell, J., 2018. Definitions, classification, and epidemiology of obesity.
Ritchie, H. & Roser, M., 2017. Obesity. Our World in Data.
Romain, A., Marleau, J. & Baillot, A., 2018. Impact of obesity and mood disorders on physical comorbidities, psychological well-being, health behaviours and use of health services. Journal of affective disorders, Volume 225, pp. 381-388.
Siahpush, M. et al., 2014. Prolonged financial stress predicts subsequent obesity: Results from a prospective study of an Australian national sample. Obesity, 22(2), pp. 616-621.
Smith, K. & Smith, M., 2016. Obesity statistics. Primary care: clinics in office practice, pp. 121-135.
Sobal, J. & Hanson, K., 2011. Marital status, marital history, body weight, and obesity. Marriage & Family Review, 47(7), pp. 474-504.
Theis, D. & White, M., 2021. Is obesity policy in England fit for purpose? Analysis of government strategies and policies, 1992–2020. The Milbank Quarterly, 99(1), pp. 126-170.
World Health Organization, 2016. Obesity. [Online]
Available at: https://www.who.int/health-topics/obesity#tab=tab_1
To complete a master’s level coursework:

All work is written by human writers. 100% AI free, guaranteed.

100% money back guarantee if you find plagiarism in our work.
COMPANY DETAILS


