Disclaimer: This is not a sample of our professional work. The paper has been produced by a student. You can view samples of our work here. Opinions, suggestions, recommendations and results in this piece are those of the author and should not be taken as our company views.
Type of Academic Paper – Dissertation
Academic Subject – Finance
Word Count – 15698 words
The current study aims to analyze the impact of the financial crisis of 2008-2009, specifically on the UK construction industry. The purpose of the research was to examine the crisis through quantity surveyors in the construction industry’s private and public sectors. The study was conducted using a mixed-methods research approach that combines quantitative and qualitative research methods to obtain more robust data to examine. Research instruments used to achieve the objectives of the study included Likert scale questionnaires and interview questions. The questionnaire was distributed to 200 quantity surveyors across ten different construction companies in the UK, primarily in England in the private and public sector. Interviews were conducted with quantity surveyors that had indicated their interest in participation on their questionnaires. The study has found that a major impact on construction companies during the recession was difficulties in cash flow and a decrease in revenue. The main business challenges indicated were dealing with the recession and maintaining profitability during the recession. It is evident from the research that quantity surveyors had faced personal issues and challenges throughout the economic recession, including the emotional toll that it took when having to fire staff because of the recession.
The 2008-2009 Great Recession caused by the Global Financial Crisis is considered one of the worst economic events since the Great Depression of 1929 (Latham and Braun 2011). The crisis began in the United States with the subprime bubble popping in the mortgage sector, which eventually spread throughout Europe’s economies catching on in parts of Asia, South America, and Africa. The Global Financial Crisis (GFC) results are currently still in effect, with many subsequent events unfolding in real-time. These include the debt crisis of Greece and Spain. The financial upheaval has led to shortages in the stock markets, credit markets, decreased corporate profits, and a rise in unemployment. The United Kingdom had officially entered into a recession in January 2009.
Since the onset of the recession, the UK’s gross domestic product (GDP) has sharply decreased in 2008 and continued to do so until 2009 (Atkins 2009). Peston (2008) asserted that the UK experienced the worst economic downturn since the Second World War. The construction industry in the UK was not immune to the worsening situation, eventually entering into the phase of deflation in 2008, with the industry still attempting to recover, only to be hit by the British Referendum 2016 (Brexit). According to the Office of National Statistics (ONS) (2008), the construction industry’s revenue generation has fallen by 1.1 percent during the fourth quarter of 2008. The result was the loss of massive jobs between 2009 and 2011 (ONS, 2015).
The construction industry was badly affected by the GFC in 2008-2009. Evidence of this is presented in Sonson (2014), who states that the new order in the construction industry had decreased by 39 percent in the third quarter of 2008, a large reduction compared to that in 2007. It is noted that during the time period, there was a reduction in private house orders by 62 percent on average, with public housing orders reducing by 36 percent. According to ONS (2008), private housing orders began to fall in 2008 by 43 percent and further decreased by 32 percent in 2009. The industry saw a reduction in workload by 0.7 percent in 2008; an additional decline in 2009 presented itself with 3.1 percent (ONS 2008).
One of the most devastating impacts on the construction industry due to the events of GFC was decreasing salaries and excessive job cuts (Latham and Bruan 2011). Figures presented by Felstead et al. (2012) states that about 400,000 jobs in the construction industry were lost between 2009 and 2010. Studies by Frei (2010), Hoxley (2010), and Dikeman et al. (2010) argue that both the private and public sector companies had significantly downsized and restructured themselves to survive the major impacts of the recession, resulting in loss of resources about technical and expert human capital. Many quantity surveyors experience the looming threat of recession, making their job quite redundant (Hoxley 2010). Consequently, quantity surveyors played an imperative role in recharging the construction industry through the recession and helping it grow once the economy was in recovery mode (Henry 2013).
Chiang et al. (2013), CIC (2013), and Henry (2013) agree that quantity surveyors play a critical role in ensuring that resources of the construction industry are used to the fullest extent for the company, industry, and greater society. Chiang et al. (2013) emphasize that quantity surveyors can be extremely useful for the financial management of projects, cost consultation services for clients and designers throughout the project’s lifecycle. Quantity surveyors are important consultants for their employers in both the private and public sectors. The only difference between the two sectors is their use of the surveyors – for the private sector, that means focus on profit maximization. At the same time, the public emphasizes their use for accountability of public finance. However, over the last few decades, both the private and public sectors have combined their differing aims to compete in the market with one another for construction projects, increased business, and profit (Alfred 2007).
Considering the great importance placed on quantity surveyors in construction companies, it is essential to analyze the impact the economic recession may have on them. Analyzing their perspective can provide researchers with better insight on how to deal with catastrophes like the economic decline to stabilize markets and prepare them for impact since the GFC 2008-2009 researchers have focused on vast markets around the world to examine the factors causing the event and the immediate and long term consequences of it. It is essential to investigate the crisis from a quantity surveyor’s eyes because of their crucial role in the construction industry. Based on preliminary research, the following primary research question has been developed.
How has the Great Financial Crisis of 2008-2009 impact quantity surveyors and the UK’s construction industry?
To help answer the primary research question, sub-questions were developed that are as follows;
The study’s primary aim is to analyze the impact of the financial crisis on the construction industry in the UK and quantity surveyors to understand the challenges and issues they faced to survive. To achieve this aim and answer the research questions, the following objectives have been developed.
The current study will use a systematic literature review to gather, organize, and examine existing literature. The purpose of using a systematic literature review allows the researcher to use vast-ranging literature in an organized manner (Cooper 2003). According to Bem (1995) and Cooper (2003), the systematic literature review is an efficient way to recognize, evaluate, and incorporate published academic papers relevant to the study and address its research questions, aims, and objectives. The current study aims to comprehend the relationship between quantity surveyors and their role during financial crises; this includes the strategies they use, their influence on the construction companies, and how financial crises may reciprocate surveyors’ influence. Randolph (2009) argues that systematic literature reviews can present relationships between topics through the inclusion of contradictory material, identifying gaps in previous research, and even inconsistencies.
The primary event studied in the current research is the Great Financial Crisis 2008-2009. This makes it imperative to differentiate between financial and economic crises to ensure that the current research has a definitive foundation. Academics like Valencia and Laeven (2008); Dikmen et al. (2010); Latham and Braun (2011), Jensen and Johannesson (2013) have all defined a financial crisis as a “disruption in the financial market in which antagonistic selection and moral hazard issues worsen causing financial markets to become unable to efficiently channel funds to those who are the most productive investment opportunities.” Others define a financial crisis as any broad issue that results in some financial assets suddenly losing a large part of their normal value. Many financial crises that plagued the 19th and 20th centuries have been associated with banking panics which led to many recessions. Valencia and Laeven (2008) have identified other situations like stock market crashes and bursting of financial bubbles, currency crises, and sovereign defaults as financial crises. According to Valencia and Laeven (2008), the financial crisis results in a direct loss of paper wealth, but it does not really impact the real economy. On the other hand, academics like Lim et al. (2010) argue that financial crises are a lot more severe. Instead, they define it as a threat to the country’s money supply. In summary, a financial crisis is an event that results from the failure of financial markets to function effectively, causing a sharp decline in economic activities.
There is a skinny line that separates the difference between a financial and economic crisis. Most often, the wider economic crisis is grouped into a recession and depression. According to Adebamowo (2011), an economic crisis is an event in a country’s economy experiencing a sudden downturn caused by a financial crisis. Bem (1995) states that economies facing an economic crisis are more likely to experience a declining GDP, drying up liquidity, and rising or falling prices due to inflation or deflation. Alfred (2007) states that a negative GDP growth that lasts for two or more quarters is labelled as a recession. A prolonged or severe recession can convert into a depression. However, long periods of slow growth, but not negative growth, is labelled as economic stagnation. Economists like Friedman (1963) have argued that recessions are caused largely by the financial crisis, one of the most prominent examples being the Great Depression of the 1930s caused by bank runs and stock market crashes. Similarly, 2008-2009 caused by the subprime mortgage crisis and bursting of real estate bubbles worldwide led to the Great Recession. However, many economists argue that recessions cause financial crises. Economists like Friedman and Schwartz (1963) argue that even where a financial crisis occurs, the initial shock that sets off a recession, other imperative factors impact it by prolonging it. A common example cited is the decline that is linked to the crash of 1929 and the bank panics that followed in the 1930s would not have prolonged the depression if they were not reinforced by specific monetary policies that were issued by the United States Federal Reserve (Friedman and Schwartz, 1963).
One of the great contributors to the development of the financial crisis was the subprime bubble burst that began in the United States in the third quarter of 2007 as investors began to lose their confidence in mortgages’ value. What followed was a liquidity crisis in lending banks like Bear Stearns and Lehman Brothers (both failed and filed for bankruptcy) when losses of subprime loans resulted in bank panic, causing GFC. Lehman Brothers and Bear Stearns were using high-grade structured strategies that were being packed and bundled with thousands of low-credit quality mortgages and sold to banks like Wachovia, Citigroup, Lehman Brothers, Bear Sterns, Bank of America, and JP Morgan. When the market was healthy, banks like Lehman Brothers and Bear Stearns could obtain a return on investment that was 11 to 15 percent high. Bear Sterns and Lehman Brothers thought that making such deals would increase their margin or even double if their subprime borrowers defaulted because these loans were packaged so that they were perceived safe due to the diversification. The high-interest payments from the remaining families with mortgages would compensate for those that fell behind. It was also believed that a bank could seize the property of those who have defaulted and sell it for a value within the loan amount’s cost. Several lending practices by banks at the time had contributed to worsening the situation and setting up the field for a financial crisis.
During 2008, many countries like the UK, USA, and many European countries borrowed from Asian and Middle Eastern countries using loans used to purchase hoses and support the development of property (Ofori and Toor, 2012). This practice alone caused a sharp increase in the value of assets that were held. At the time, lenders were more willing to lend, up to 100 percent of purchase power, as evidenced by research conducted by Atkins Group (2009) and Adebamowo (2011). Studies conducted by Cacciator and Jacobides (2005), Chiang et al. (2013), Rostami et al. (2015) have found that the increase in home prices can only be attributed to the housing bubble at the time. However, there seems to be no other explanation for the sudden rise in the relative demand for property which allows us to explain the increase in price and increase in property purchase prices compared to those of rental prices (Abidin, 2014). Abidin (2014) explains that an exceptional increase in housing prices leads one to believe in the actual existence of the housing bubble. Others have noted that the sudden increase in home sales was the expectation that the market had that housing prices would increase further in the future (Williams et al., 2013). Studies conducted by Lim et al. (2010) and Ofori and Toor (2012) found that although the techniques were sustaining home properties for a specific time period, they would eventually be brought to an end.
Indeed it did – the bubble had burst, and asset processes began their downward spiral. The bubble burst suddenly caused a decrease in asset prices, making it difficult for investors who had borrowed funds to repurchase those assets, causing a struggle to pay for liabilities. As a cushioning mechanism against the blow, investors sold off their other assets, causing a decline in housing assets’ price. Hence, there was an increase in defaulting banks, banks with dried resources, and less credit being readily available, resulting in decreasing asset prices. Further along the lines, there was an additional narrowing of lending, which led to the gradual cycle of decline for financial markets. These events brought forth the financial intermediation of banks declining, which led to a subsequent decline in financial markets’ complete economic activities. However, some other financial practices and violations were rampant in the market, contributing to the global financial crisis.
The company management team at Lehman Brothers thought it would be supremely clever to engage in commercial real estate at a more aggressive rate than norm real estate. It was believed that low-quality family borrowers would make mortgage payments. Thus the company began using its short-term cash on hand to flip real estate deals. Richard Fuld served as the CEO of Lehman from 1994 to its collapse in 2008. During his tenure as CEO Lehman, they had moved into being the first Wall Street firm to conduct the business of mortgage origination. Under his leadership, the company went on a spending spree of buying up lenders to expand their mortgage origination pipeline by purchasing companies such as BNC Mortgage LLC, a subprime mortgage lender, and Aurora Loan Services. Under these acquisitions under Fuld’s leadership, Lehman transformed into a real estate hedge fund disguised as an investment bank. During this time, Lehman had borrowed a significant amount of funds for investing, which was its direct cause of bankruptcy in 2008 through the process of leveraging. Plenty of its investments were in housing-related assets, making the company vulnerable to a downturn in that specific market. According to Pirson and Turnbull (2011), the company had used an excessive leverage ratio to chase profit in all manners of back mortgage securities. Lehman Brothers and five other banks had asked for a waiver of the 1975 net capitalization rule, which resulted in the SEC issuing the Bear Stearns exemption, which displaced the older ratio of 12 to 1, the modest leverage ratio (Swedberg, 2010). The company’s decision showed a conscious risk management decision that left no room for error and no buffer to absorb losses (Prison & Turnbull, 2011).
Lehman also participated in shady accounting maneuvers known as Repo 105 that misinform investors. Every quarter, Lehman would sell short-term repurchase agreements to create the temporary appearance of cash on its balance sheets to offset the growing value of the debt it was racking up. Under this technique, the company looked less leveraged than it was. However, after the quarterly earnings report, the company would reverse the repurchase agreements, and the cash was drained out from its balance sheets. Evidence shows that Lehman Brothers had used a small company, Hudson Castle, to move a great number of its transaction and assets off Lehman’s books as a way of manipulating accounting numbers of the company’s finances and risks. There is evidence to suggest that Lehman had owned one-quarter of Hudson Castle, with the board being controlled by Lehman and a majority of the staff being former Lehman employees (Fishman, 2008).
McDonald (2009), a senior Lehman Brother trader, reported in the years leading up to the financial crash that Fuld possessed “smouldering envy” against Goldman Sachs and Wall Street rivals which led him to ignore the warning signs from Lehman executives about the impending crash while also insisting that the company’s Chief Risk Officer (CRO) leave the boardroom during imperative discussions (as cited in Dowd, 2009).
Lehman Brothers are not the only bank that contributed to the Global Financial Crisis. The modern financial market had participated in actions that caused the financial crisis and subsequent recession. During the G20 Summit of 2008, in its “Declaration of the Summit on Financial Markets and the World Economy,” the leaders had issued the following statement that summarised the factors attributed to financial markets for causing the crisis and recession:
“During a period of strong global growth, growing capital flows, and prolonged stability earlier this decade, market participants sought higher yields without an adequate appreciation of the risks and failed to exercise proper due diligence. At the same time, weak underwriting standards, unsound risk management practices, increasingly complex and opaque financial products, and consequent excessive leverage combined to create vulnerabilities in the system. Policy-makers, regulators, and supervisors, in some advanced countries, did not adequately appreciate and address the risks building up in financial markets, keep pace with financial innovation, or take into account the systematic ramifications of domestic regulator actions.”
The statement issued by the summit provides a small glimpse into the factors that contributed to forming the Global Financial Crisis in 2008. One of the major reported factors was lax regulations that encouraged negligent lending standards. According to a study by Wallison (2009), private lenders were encouraged to relax their lending standards and policies by the government themselves. The line of logic pointed out is the Housing and Community Development Act of 1992, which had made it imperative to have 30 percent or more of Fannie Mae and Freddie Mac’s loan purchased be related to affordable housing. However, the legislation provided the department of Housing and Urban Development (HUD) to set any future requirements that eventually went up to 56 percent minimum. According to Wallison (2009), to fulfill the requirement, both Fannie Mae and Freddie Mac had developed programs to purchase about 5 trillion USD of affordable housing and then encouraged their lenders to relax the underwriting standards needed to produce a loan.
Other experts indicate that the type of derivative known as the credit default swap (CDS) had allowed speculators to stack bets on the same mortgage securities, which is almost like allowing more than one person to buy insurance on the same house (Hoxley 2010). According to Construction Industry Council (2014), many speculators that had bought CDS protection were in a sense betting that significant mortgage security defaults would occur while big sellers (i.e., American Insurance Group) were betting against these odds; these amounts wagered were of an unlimited amount. In the circumstance when massive defaults had occurred, companies that were those selling the CDS insurance product were unable to perform and ended up defaulting. Brown (2009) notes that derivatives like CDS were barely regulated or completely unregulated. Kollewe (2011) finds that the US government failed to supervise or ask for transparency of these financial institutions – derivatives.
All industries in the global market were hit indiscriminately by the Global Financial Crisis of 2008. Specific studies like Sonson (2014) used surveys to report that new order taking in the construction industry had declined by 39 percent in the third quarter of 2008 compared to the previous year. Sonson (2014) also reports a decline in private housing orders by 62 percent in 2008, and public housing orders declined by 32 percent in 2009 alone. The Office of National Statistics (2008) states that order taking for private housing had already begun to fall by 43 percent in 2008, while this followed in 2009, with orders falling by 32 percent. The Office of National Statistics (2008) also reports that a workload reduction by 0.7 percent in 2008, and it further declined in 2009 by 3.1 percent. Further evidence collected from the Office of National Statistics (2015) provides data for the output of new housing used to analyze the impact of the industry’s recession. This data analyses the impact on both the private and public sectors (see Fig.)
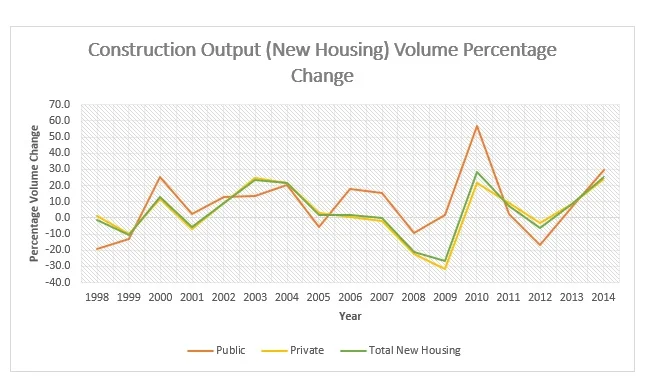
Figure 1- Yearly Volume of New Housing Output in Great Britain (1998-2014) (ONS, 2015)
Based on Fig. 1, there was a sharp decline in the output of new housing since 2008 when the recession was in full swing, specifically in the private housing section that had witnessed a decline by 20.8 percent from 2007 to 2008 (ONS, 2015). In the UK, between 2009 and 2010, the private sector had attempted to gradually increase the output of new housing by 528 percent, while the public sector witnessed 54.8 percent (ONS, 2015). In total, new housing output in 2007 was closed to 0.1 percent with a sharp fall in 2008 with -22.0 percent, further falling in 2009 to -25.8 percent. This sharp decline in new out explains the sudden decline in the construction industry because of the recession that had come out in full force from 2007 to 2009.
One of the most devastating aspects of the construction industry’s recession was the sudden fall in salaries and instant job cuts (Latham and Braun, 2011). This is backed by Felstead et al. (2012) ‘s assentation, whose study found that 400,000 jobs in construction during the recession period of 2009 and 2010. Studies conducted by Frei (2010), Hoxley (2010), and Dikmen et al. (2010) have reported many private and public construction companies are significantly downsizing and restructuring themselves to survive the aftermath of the recessions that may have caused technical and expert losses.
The methodology chapter of the current study introduces essential concepts that are the foundation of education. This includes the conceptual theories that make up the chosen research design – the mixed-methods approach. The discussion begins with introducing what mixed methods research is and the philosophical base it stems from realism. Establishing an epistemological stance is essential to guide the entire research when attempting to provide premises to develop a persuasive argument. The chapter further goes on to discuss the techniques in data collection and analysis. The categories have been broken down to incorporate the mixed methods approach to quantitative and qualitative techniques.
The majority of research is primarily split between the primary schools’ of through – positivism and interpretivism. However, unlike these two theoretical approaches, realism can reflect two fundamental ideas:
Positivism and interpretivism focus on the importance of one of these stances over the other, but realism argues that both are equally important. Andrew and Halcomb (2009) argue that to study any topic adequately, it is essential to combine the understanding of its empirical reality with its meaning to different individuals. Often time’s realism is associated with the term ‘post-positivism as both realism and positivism. But it is in its own a separate philosophical stance that justifies mixed methods research.
Considering the above discussion on realism, the current study uses the mixed methods approach for research. Mixed methods research is an emerging trend in the research community and is defined differently by academics in terms of the methods used, research philosophy, processes, and design used. Greene et al. (1989), an early writer of mixed methods research, that mixed methods research can be defined as those that include at the least one quantitative method and one qualitative method. Neither of the types of methods is inherently linked to a specific kind of paradigm (as cited in Creswell and Plano Clark, 2011). However, academics like Tashakkori and Teddie (1998) moved the definition from mixing two methods to ensure that all aspects of the study are combined throughout the entire research process. They defined mixed methods research as a combination of quantitative and qualitative approaches in the study’s methodology (Tashakkori and Teddlie, 1998). Denzin and Lincoln (2011) define mixed methods research as a type of research that allows researchers to combine many elements of quantitative and qualitative research approaches in one study.
Various types of mixed methods research have been developed over the years, ranging from partially mixed to fully mixed with any number of subcategories (Leech and Onwuegbuzie, 2009). A summarization of these approaches had been illustrated in the figure below. Based on Fig. 2, it is evident that there are many ways to identify the type of mixed methods research approach that can be used. The level of mixing is identified by partially mixed or fully mixed. Sale et al. (2002) argues that mixed methods research design actually lies on a continuum, but it can still be classified as a representation partially or fully mixed. In Fig 2, time orientation references the methods – do quantitative and qualitative phases occur simultaneously; if so, then they are concurrent. However, if they occur at different times, they are then represented as sequential (Sofaer, 2002). Hennink et al. (2010) also argue that an emphasis needs to be placed on the significance of the approaches used. Hennink et al. (2010) asserted that there is a possibility of labelling one of the approaches with a dominant status or placing the weight of equal status on them based on their priority.
A thorough literature review allows the current study to justify its status, so the mixed methods research approach is currently being used. The current study chooses the stance of F3 – fully mixed sequential equal status design (see Fig. 2). A fully mixed sequential design will involve conducting the study in two phases that occur sequentially. The first phase of the study would mean conducting the quantitative portion of the study first, followed by the qualitative portion (QUAN à QUAL).
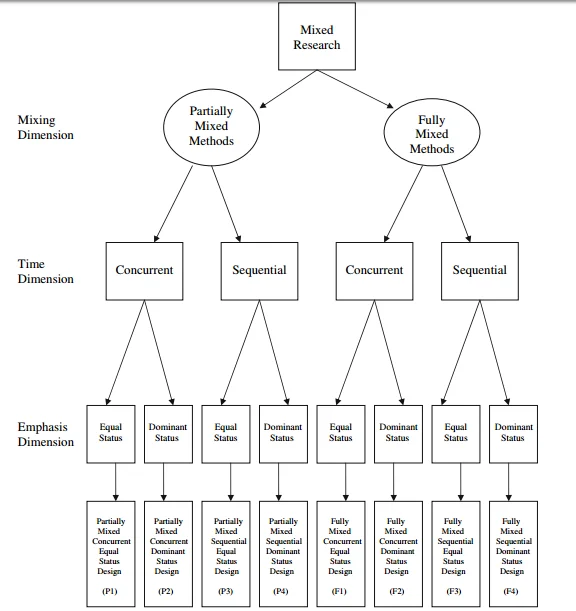
Figure 2- Typology of Mixed Research (Source; (Leech & Onwuegbuzie 2009)
According to the Office of National Statistics (2017), 53,000 quantity surveyors are currently employed in the UK. For the first phase of the study (quantitative), it was essential to case a wide net ensures that the respondents’ maximum number can be selected to participate in the survey. The sampling technique used for the quantitative portion of the study was stratified random sampling, the most a form of random sampling technique used to select a group of respondents from the larger population of quantity surveyors (Zhao et al. 2014). Zhao et al. (2014) argue that using the method means that each of the respondents chosen is concentrated and has an equal chance in their groups to be included in the study’s sample. Based on this method, a total sample of 200 quantity surveyors will be needed to participate for the quantitative portion of the study from 10 different construction companies, with each company providing at least 20 of their quantity surveyors. Five companies are from the public sector, while the remaining five are from the private sector. The quantitative portion of the study includes a survey, as discussed below.
The next phase of the study is the qualitative part which will require 20 respondents to participate. A complete discussion on data collection for this portion is discussed below. The sampling method used for this portion of the research is mostly convenience sampling. Based on the respondents’ interest, they will indicate their questionnaire form if they are willing to participate in the study’s interview portion.
The first phase of research is the quantitative research approach which will use a questionnaire as a research instrument for data collection. According to Saris et al. (2016), a questionnaire is a research instrument made up of a series of questions to gather information from respondents. The current study uses a psychometric scale that is commonly known as the Likert Scale. The Likert Scale is generally used to scale responses in a survey study and was first developed by Rensis Likert (Reips et al., 2008). Busch (1993) states that Likert scales are used to examine the respondents’ attitudes toward social issues. They are composed of three or more ordinal scale categories placed on a continuum with specific items using a question or a statement where participants are asked to judge in terms of frequency, evaluation, or agreement (Reips et al., 2008).
The questionnaires will be distributed using the conventional approach through prepaid return envelopes and an electronic survey using Survey Monkey. Both modes of conducting the questionnaire will be distributed to different construction companies in the UK to ensure that maximum people have the chance to participate. It will be necessary that respondents submit their questionnaires within a period of thirty days.
The second phase of the study will include interviews with twenty respondents. These respondents will have indicated on their questionnaires if they wish to participate in the study’s interview portion. Interviews are generally described as a method of data collection that provides individuals with the opportunity (interviewer) to ask other people questions (interviewee) either face-to-face or through other mediums like telephone and no internet (Polit and Beck, 2006). Interviews are considered one of the most commonly used research instruments for data collection (DiCicco-Bloom and Crabtee, 2006). The chosen method for the current study is semi-structured interviews organized around a set of pre-developed questions that will eventually allow a dialogue to emerge. Sorrell and Redmond (1995) argue that semi-structured interviews allow the interviewee to develop a personal and intimate conversation that allows for an open-direct communication channel to develop as a means for uncovering a narrative of the interviewee.
For the current study, interviews should be conducted on Skype, a video calling, and conferencing application. Deakin and Wakefield (2013) have argued that Skype is the best medium for accessing participants located in a hard-to-reach area, making the process inexpensive. It also ensures that neither the interviewer nor interviewee invades each other’s private space nor makes the entire process safe for both parties. Each interview will be conducted for at least thirty minutes.
The phase of data analysis will also be conducted sequentially, starting with the quantitative data analysis. To analyze the data, the current study will employ three distinct methods. They were the first descriptive statistics. This portion of the analysis will analyze the frequency of responses in the sample. The common elements analyzed are the median of the responses and their frequency distribution. The next data analysis technique employed is a relative importance index analysis that will analyze the main factors that have contributed to challenges quantity surveyors faced, their role in the financial crisis, and the strategies they employed. It is also essential that a Cronbach’s Alpha analysis analyze the reliability of the questionnaire developed. The next portion of the analysis includes a thematic analysis. This will be conducted for the qualitative data that was collected. The thematic analysis will analyze the themes and their occurrences in the interviews conducted using quantity surveyors.
Extensive research conducted in the literature review portion of the study allowed for the development of the methodology. The results of the study were obtained from extensive and meticulous work conducted using the methodology. The results of the current study examined the respondents’ demographic makeup and their answers to the questionnaire form developed using the Likert scale. The questionnaires were disrupted to construction companies in the UK using both pre-post mail and an online medium – Survey Monkey. The entire data from the questionnaire responses were accumulated and then analyzed to induce meaningful results. A crucial portion of the process was ensuring that internal consistency was present in the questionnaire form, and therefore, a Cronbach’s Alpha measure was taken. The second phase of the research included an interview portion that was analyzed based on thematic data gathered. The results of the interview included themes discussed with quantity surveyors. The current analysis chapter is divided into subsections to scrutinize the data from the quantitative portion and then the qualitative portion. The current study results allow the researcher to form a link between the economic crisis of 2008-2009 and its impact on construction companies in the UK, specifically on quantity surveyors.
The main aim of the current study is to analyze the impact of the financial crisis on the construction industry in the UK and on quantity surveyors in terms of the challenges and issues faced for the construction firms to survive during that time of economic upheaval. Based on the early investigation, it was confirmed from the Office of National Statistics (2017) that 53,000 quantity surveyors were employed in the UK in the public and private sectors. The vast population was sought after using stratified random sampling, which used a total of ten different construction firms looking to use twenty of their quantity surveyors for the process. The characteristics of the sample were some part homogenous. However, each quantity surveyor was asked to indicate specific demographic information to create a profile of the study respondents. The intended target of the sample was 200 (n=200). However, the completed returned questionnaire totaled 143. Therefore, the response rate of the current questionnaire was 71.5 percent. However, of the 143 returned surveys, 29 were incomplete and could not be included in the data analysis. This has left us with 114 completed questionnaires. The following is a breakdown of the response obtained from the population pursued. Based on Figure 3, 15 percent of respondents had incomplete questionnaires that were not included in the final analysis of the study. A strong response from respondents came from online as 42 percent of participants had completed and submitted an online questionnaire from Survey Monkey. The most probable reason for this may be that internet access has become common, and respondents prefer convenience when participating in studies like this. Only 15 percent of respondents had completed and sent in their questionnaires via post, while 28 percent of respondents had not participated in the study.

Figure 3- Participant Response Analysis
The first section of the questionnaire totals seven questions designed to acquire background about the respondents. Each of the responses to the questions is explained in this section by illustrating the respondents’ answers using charts and graphs. The responses of the questionnaire are chronologically analyzed according to the question number in the questionnaire. The first question of the survey asks participants to document the company’s size that they are currently employed in. The responses are illustrated in Figure 4; based on the results, 34.21 percent of respondents work at a company that employs more than 200 employees. Of the respondents, 32.46 percent indicated that their company employees 50 to 200 employees. While on the other hand, 27.19 percent indicated that their companies have 20 to 50 employees and 6.14 percent indicated that they employed less than 20 employees.
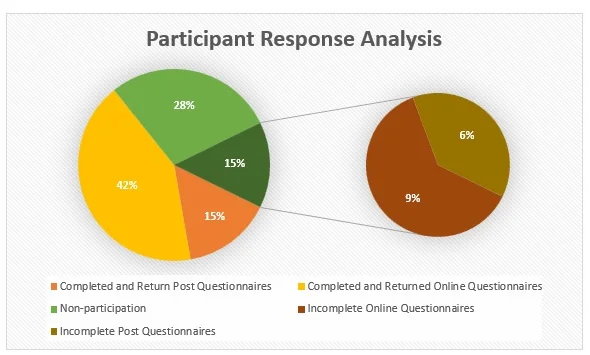
Figure 4- How many people are employed in the organization that you work for?
Each of the respondents was asked to indicate their employment in the current company that they worked for. The responses are illustrated in fig. 5, which shows that the majority of respondents, 40.35 percent, have been employed with their current company for 10 to 15 years. Respondents, 36.85 percent, had indicated that they worked for the current company for 5 to ten years. This indicates that most of the respondents of the questionnaire had been employed in their current company during the financial crisis in 2008-2009. It can be implied that the insight that they provide to the research is important, and the responses provided are from firsthand experience into the challenges, impact, and remedies to the crisis. On the other hand, 13.16 percent of participants indicated that they were employed with their current company for more than 15 years. Their insight into the financial crisis is precious due to their extensive experience. Lastly, only 9.65 percent of respondents indicated that they were employed with their current company for less than five years.
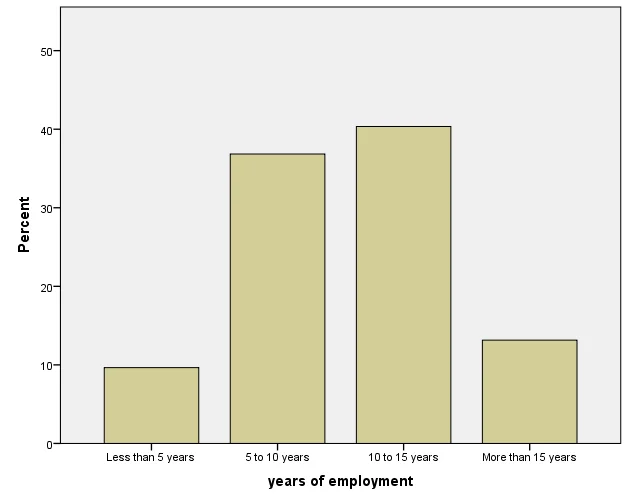
Figure 5- How long have you worked for the organization that currently employees you?
Respondents were also asked to indicate their employment status with the current firm during the financial crisis between 2008 and 2009. Based on the results, 64.91 percent indicated in the positive that they were employed with their current company during the financial crisis. On the other hand, 35.09 percent of respondents indicated the negative that they were not employed with their current company during the financial crisis. Respondents were also asked to indicate the type of customer that mostly uses their business services (fig. 6).
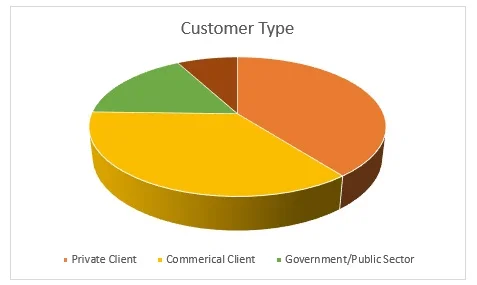
Figure 6- What type of customer does the company you are currently employed with work for?
A majority of the respondents, about 40 percent, had indicated that their companies mostly cater to private clients that request their business services. Commercial clients were the next major client base, with 35.96 percent asserting that they used their company’s business services. Only 16.67 percent indicated on their questionnaire that government/public sector clients used their business services. In comparison, 7.89 percent responded that sub-consultants for construction and consultation firms sought their business services. Although this is a tiny sample compared to the wider population, it seems that the UK construction industry, particularly the firms studied, mostly catered to a market for private clients and commercial clients. Any form of economic upheaval gravely impacts the commercial and private sectors the most. As a result, this would impact the construction companies that hold a majority of clients from these sectors.

Figure 7- Please indicate from the following the primary sector of activity in which the current firm that you are employed participates.
Participants were also asked to indicate the main sector activities that the company they work for deals in. The responses are illustrated in fig. Seven below. Based on the responses, 22.81 percent of respondents indicated that their company divulges in multi-disciplinary activities. About 21 percent of participants reported that their companies participated mainly in town and urban planning activities. Another of the most indicated main sector of business by those responding to the questionnaire was engineering-related consultancy; about 18.42 percent of participants had stated this. The least activity in the primary sector was found in .88 percent of participants that stated quantity, building surveying as their primary sector of business, and 1.75 percent reported it as project management. In comparison, another 2.63 percent indicated landscaping as the primary sector of business.
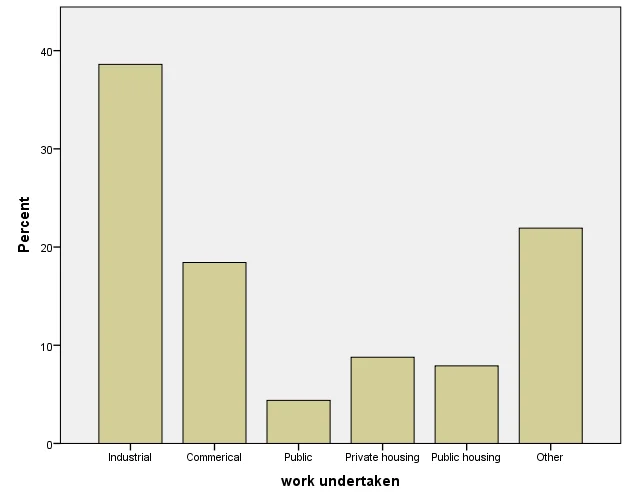
Figure 8- Please indicate from the following the type of work undertaken at the company that currently employees you
Participants were also asked to indicate the work undertaken and the primary type of work at the current company that employees them. The responses to both these questions are illustrated in figs—8 and 9, respectively. The majority of work undertaken at these companies, according to 38.60 percent of respondents, is industrial work. However, the primary type of work, according to 42.11 percent of respondents, is commercial work. Only 23.68 percent of respondents were the main work in the company industrial, while commercial work was undertaken indicated by 18.42 percent as the work is undertaken. These respondents correlate with those provided in question four, which asked to show the type of customer most catered to – commercial clients.
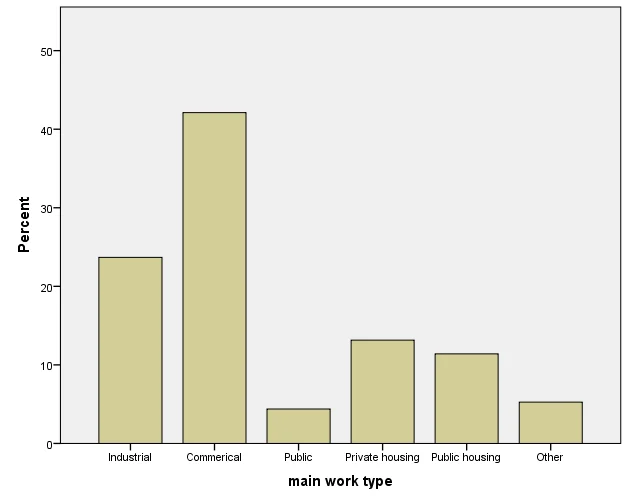
Figure 9- Please indicate the MAIN type of work at the company that currently employees you from the following.
Before divulging the results of the questionnaire, a Cronbach’s Alpha analysis was conducted. Cronbach’s Alpha (α) (i.e., referred to as Alpha or α through the study) is an important measure and model for examining questionnaires, particularly those of Likert characteristics (Trizano-Hermosilla & Alvarado 2016). Okada (2015) argues that the use of Alpha is essential for all research as the quantification of alpha increases or improves the research’s validity and accuracy for interpretation of data. The current study uses Alpha to examine the Likert scale items for the second set of questions in the questionnaire. The second part of the survey consisted of twenty-five (25) Likert scale questions that measured the participant’s attitudes of sed on a five-point scale; 1- strongly disagree, 2- disagree, 3- neither disagree nor agree 4- ag strongly agree. The table below illustrates the alpha results for the 25 sets of items.
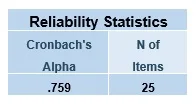
Table 1- Reliability Statistics (Alpha Results) for Questionnaire
The rule of Alpha to compare the results was obtained from the study of Kline (2000) and DeVellis (2012), illustrated in table 2 below. Based on this, a data set’s internal consistency is considered acceptable if the value of Alpha falls between 0.8 ≥ α ≥ 0.7. According to Kline (2000), the closer Alpha is to 1.0, the greater the internal consistency of the items within the scale. The alpha calculations were produced using the IBM Statistics SPSS v.24 software package. Based on Alpha’s analysis, the current study’s internal consistency can be considered acceptable as the value of Alpha obtained was .759, which lies between the 0.8 ≥ α ≥ 0.7 rule.
Although the alpha value is considered imperative by many academics (i.e., Kline 2000; DeVellis 2012; Okada 2015), many other studies like those conducted by Cortina (1993) and Cheng et al. (2014) assert that the use of Alpha is overrated. According to Cheng et al. (2014), the higher the number of items on the list, the more significant the influence on artificially inflating the alpha value.
Table 2- Cronbach Alpha Result Scale
To counter the arguments of Cheng et al. (2014), individual item statistics were produced using SPSS to analyze alpha values when specific items were deleted from the analysis. This caused the number of items analyzed to decrease, creating different values of Alpha. The results of this analysis are illustrated in Appendix C. Clearly, once specific details of the questionnaire are deleted, Alpha begins to vary between values less than 0.5 and greater than 0.5. Various ranges of Alpha have produced that range from unacceptable to good. Hence, Cheng et al. (2014) are countered by proving that alpha value need not be influence by only the number of items in a set. Each item in itself brings with it a mean and variance that influences the Alpha.
The next section of the questionnaire was analyzed to examine the range of responses submitted by participants. These responses were analyzed using SPSS v. 24 software package and then graphed in a net-stacked distribution to compare the participants’ reactions. The 25 questions were categorized according to the main impact felt by the quantity surveyors during the economic crisis, the business challenges of the economic crisis, and the main steps to meet the challenges presented during the economic crisis. For each of the categories, the respondents were provided with statements and asked to present their agreement level based on a five-point scale ranging from 1 being strongly disagreed to 5 strongly agreeing.
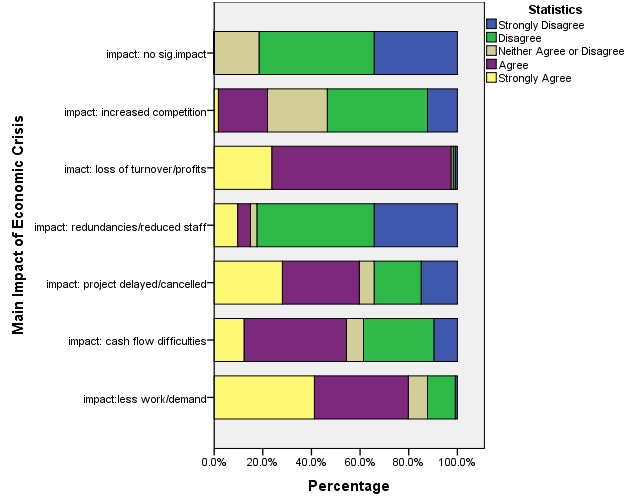
Figure 10- Main impacts of the Economic Crisis 2008-2009
The first section asked respondents to present their opinion of the main impact felt during the economic crisis on the business they worked for. The opinions of the respondents are presented in fig. 10 below. The greatest main impact of the economic crisis is seen as a loss of turnover and profits, as indicated by 97.36 percent of respondents. According to 79.83 percent of respondents agreed or strongly agreed that the economic crisis’s main impact was less work or demand. The next most significant impact from the economic crisis is project delays and cancellation, as 59.65 percent of respondents indicated using strongly agreed and agreed. However, the least main impact from the economic crisis was seen as redundancies or reduced staff, as expressed by 82.46 percent of participants who strongly disagreed and disagreed. While 53.51 percent had indicated that the economic crisis’s least impact was increased competition by indicating strongly disagree or disagree. However, 81.58 percent had disagreed or strongly disagreed that no significant impact was during the economic crisis of 2008-2009.
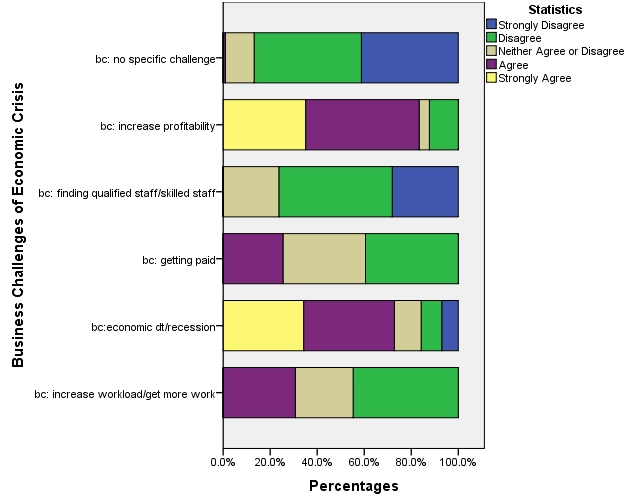
Figure 11- Main business challenges of Economic Crisis 2008-2009
One of the main business challenges, as expressed by 83.34 percent of respondents using agreed and strongly agreed, is profitability (see fig. 11). The next business challenge most expressed by respondents was dealing with the economic downturn and recession, expressed by 72.81 percent who strongly agreed and agreed. The least business challenge indicated by respondents was 76.32 percent using strongly disagree and disagree was finding qualified staff and skilled staff. While 86.84 percent disagreed and strongly disagreed that no specific business challenge was faced during the economic crisis.
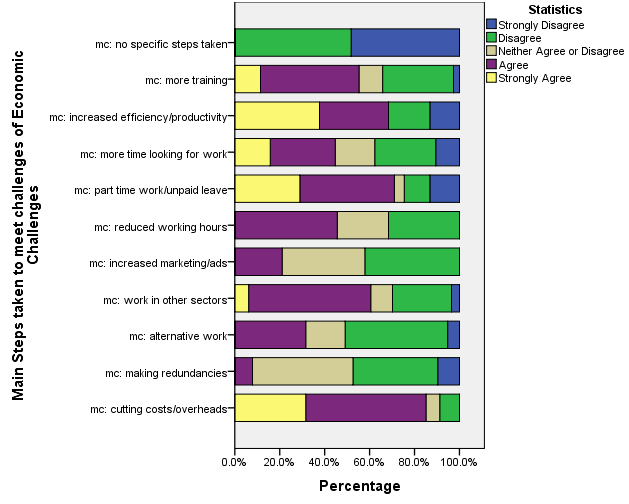
Figure 12- Main steps were taken to meet the challenges of Economic Crisis 2008-2009
Respondents were asked to indicate the main steps to meet the business challenges, which are illustrated in fig. 12 above. According to 85.09 percent of respondents, the main step used to meet the economic crisis’s business challenges was cutting costs and overheads. The next most used step for meeting business challenges was encouraging staff to work part-time or take unpaid leave, determined by 71.06 percent who indicated strongly agreed and agreed. The third most preferred step, as indicated by respondents, was increasing the amount of training that was given to employees to meet the challenges of the economic crisis by 68.42 percent of respondents. The last step taken for meeting business challenges was to increase marketing and advertisement techniques, as indicated by 42.11 percent of respondents who disagreed. At the same time, 47.37 percent indicated that making redundancies was a step to meet challenges. Lastly, 50.87 percent indicated that the least step taken was seeking alternative work. On the other hand, 100 percent of respondents indicated with disagreement (i.e., strongly disagree and disagree) that no specific steps were taken economic crisis’s business challengesnomic crisis.
To further examine the questionnaires’ results, a relative importance index (RII) analysis was used. The RII analysis aims to rank the themes or factors that influence phenomena (LeBrton 2004). For the current study, using the RII was to examine the influence of main impacts, business challenges, and steps taken to meet challenges during the economic crisis in the construction company. According to LeBrton (2004), RII is imperative in seeking the contribution of specific variables to an entire system. For the current analysis, RIIs were conducted by categorizing the items on the questionnaire according to the main impact, main business challenge, and the main steps. Table 3 below brings to light the factors that make up the economic crisis’s main impact based on the relative importance index produced. The top 3 ranking factors are loss of turnover/profits ranked at 1, less work/demand and project delayed/cancelled ranked at 2, and cash flow difficulties at rank 3.
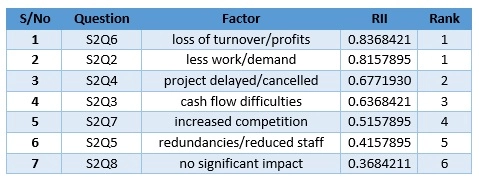
Table 3- Relative Importance Index for Main Impacts from Financial Crisis
The next category of the questionnaire went on to analyze respondents’ opinions based on what they thought to be the main business challenges at the time of the economic crisis. Based on the answers’ collection, an RII analysis took place to produce the following results in table 4. The top 3 factors that respondents thought were business challenges included increased profitability ranked at 1, economic downturn/recession ranked at 2, increased workload/getting more work, and getting paid ranked at 3. This trend is similar to the responses obtained and visualized in fig. 11.
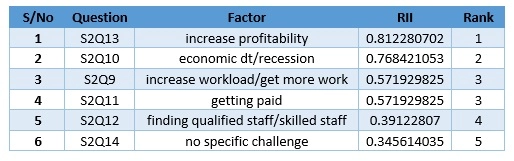
Table 4- Relative Importance Index of Business Challenges
The last category for RII analyzed respondents’ opinions based on what they believed were the main steps taken to tackle the business challenges during the economic crisis. Based on the answer’s collection, an RII analysis was produced with the following results in table 5 below. The top 3 ranking factors considered the main steps to tackle the business challenges include cutting costs/overheads, which were ranked first. The second-ranking steps taken to tackle business challenges include; encouraging staff to take part-time work/unpaid leave and increasing efficiency/productivity. The third-ranking step taken to manage business challenges was having the business work in other sectors and reading the amount even to staff.
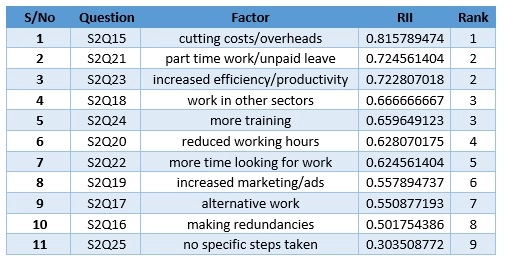
Table 5- Relative Importance Index of Main Steps take for Business Challenges.
Through convenience sampling, twenty respondents needed to conduct interviews. However, a total of 8 respondents had indicated their willingness to participate in the interview portion of the research on their questionnaire forms. The participants were homogenous as they were all quantity surveyors and had worked in their current company for 10 to 15 years. All those participating in the interview section had experienced the financial crisis 2008-2009 under the company they are employed by during the interview. To maintain anonymity, the respondents’ names or the names of their companies have not been given. Instead, individual respondents are indicated by the QS-1, QS-2, QS-3, QS-4, QS-5P, QS-6P, QS-7P, and QS-8P. The quantity surveyors that worked in private sector companies at the time of the interview were indicated by adding an extra “P” in their anonymous identification. The views expressed in the current interviews are not representative of the companies’ views that employ them.
The interview consisted of a total of ten questions. It was semi-structured to provide the interviewer with follow-up questions to allow interviewees to go more in-depth with their answers. The concepts that were found throughout the interview results were complex and lengthy. This made it difficult to portray for individual interviewees due to the limited amount of words allowed in the current study. Hence, NVIV) 9.2 was used, thematic analysis software that allowed for core concepts to be compared amongst the eight different interviewees.
All participants were asked their role in the current company they are employed in. This was elaborated to mean their job duties, responsibilities, and position in the firm. All of the surveyors interviewed were middle to high-level executives with almost the same job responsibilities and duties.
QS-6P details,
“As a quantity surveyor, it is my job to make sure to have complete and total knowledge about all of the construction costs and contracts that go into a specific project that I am assigned to, and being in my high-level position, I need to have this knowledge for all of the company’s projects. One of the major responsibilities of a quantity surveyor is to manage the risks of a construction project. We are the company’s advice machines in the fields of contracting, costs, project management, and dispute resolutions.”
All eight of the quantity surveyors interviewed had about the same answer. This provided insight into a quantity surveyors’ value to a construction company. Their responsibilities make them important to have, especially in times of an economic crisis. All eight of the quantity surveyors had affirmed that they were employed as quantity surveyors during the financial crisis in 2008-2009 and had firsthand experience of the financial crisis on their firm.
Quantity surveyors were asked to recount how the financial crisis had impacted them personally in 2008-2009. Several personal experiences shaped their view of the financial crisis. The purpose of this question was to discover if there were contrasting experiences that quantity surveyors faced based on being employed in the private or public sector. The interview portion, particularly the question, aims to answer the research question discussed in section 1.2 in chapter 1. Some of the responses to the question are detailed below.
QS-1
“I think everyone will agree with me when I say one of the most personal impacts that anyone in the construction industry experienced decreased in the payslip. Not just by a couple of quids, but major slashes into the paycheck. There was job security for me. I was with the company for over twenty years, but many good people had to be let go. There was also a major decline in the workload for me personally. I believe that it’s most likely connected with the decrease in public housing output.”
QS-3
“Completing projects on time and within budget becomes a personal issue with me. Many projects that were in the pipeline were scrapped, and our focus shifted to more infrastructure projects. It became difficult for many public sector projects to continue due to a lack of funding. But transport projects did see a big boost, the company that I worked for tendered many of the rail projects. I was essentially working longer hours for the same amount of pay. But I had to; I realized very earlier on that this economic downturn wasn’t a quick tornado that would pass through. So I just thanked my luck that I was able to keep on. I was personally afraid that I would get the pink slip any day (laughs nervously), but I was lucky enough not to.”
QS-7P
“It was tough… really tough. It may not be relevant, but, I wife had lost her job within four months of the recession. So there was a double load put on me for earning an income and keeping my job secure. Working for a private firm was difficult, particularly because we focused mostly on commercial projects, like offices and retail outlets. And those were some of the major projects that were scrapped. I had to emerge as one of the company leaders trying to hold my team together and encouraging them to take tough decisions, but I did ensure that nothing unfair happened to them. Since many redundancies in the company were cut out, we essentially had a single person working the jobs of three or even four people. It was tough, but I’m glad we made it through.”
QS-8P
“I was one of the high-level executives at my company for over five years before the recession came. One of the most difficult times I faced during the recession personally was when some of my junior level staff or even newcomers, those working on the front-line, would come into my office distraught. They had lost their jobs… and I couldn’t do anything about it. It was really hard for me. We tried for the first year to ensure that everyone stayed in their position, but it became tough. No new orders were coming in, and our company worked mostly on private housing schemes and commercial construction. Many of the major retailers we were consultants for backed out of many planned projects due to lack of funding. It became difficult to ensure that costs were kept in line and other risks didn’t act as constraints, but it didn’t turn out that way.”
The next question asked to the interview focused more on what they believed to be the impacts they witnessed on their companies during 2008-2009. The following are the results of the question.
QS-1
“The company that I worked for was hit hard. We were currently in a contract with the government to complete a series of public housing schemes. But those were scrapped about 3 to 5 months into the recession. We were experiencing dwindling profits and workload. Not many contracts were being issued as well as investors were too scared to plunge money at the time. One of the greatest impacts on the company during the recession of cash flow difficulties.”
QS-2
“We had a lot of canceled projects… a lot! A lot of the public works projects that were contracted by the government were delayed or completely cancelled. One of our saviours was the Cross Rails project. A lot of companies were clamouring to get their hands on it. So, you can say that another financial crisis impact was indeed increased competition for the company I worked for. Everyone was trying to get a piece of the project that Transport for London was offering. Because of the cancelled projects, we had a significant loss of turnover and profit. The years between 2009 and 2011 were probably some of the worst years our company faced.
QS-5P
“Our biggest clients were leisure companies and hotel chains. So as soon as the recession rolled in, we were hit with delayed projects. Many of our clients did not believe it was necessary to further many of their expansion plans under the economic climate that everyone was witnesses. Lending from banks also became quite difficult with construction costs, mainly material, and labor was becoming extremely expensive. Because of this, within a year, our company was hit financially, causing us to downsize significantly.”
QS-6P
“I think this is a common impact that many companies saw, regardless of being public or private, and that is a decrease in profit and turnovers along with a decrease in projects and work being found. Working for a private company with almost 75 percent commercial clients, we took a huge hit. Our main clients were corporate companies that look to construct offices and retailers. Both these sectors took a hard hit in the recession, and as a ripple effect, we were also hit. It was difficult to keep afloat, no fiscal stimulus package was offered to private companies, but we tried to keep afloat. The company mainly did this by providing many executives with unpaid leave or shifting a majority of the staff over to part-time work. But his was enough.”
Respondents were asked about the impact that they believed was witnessed by the construction industry. One of the key responses found was QS-3 and QS-4, who worked almost all their careers in a public sector company.
QS-3
“Our company was facing a lot of issues, primarily with maintaining a cash flow since we were operating practically at a loss. It’s because of this issue that many other issues arose. The government had slashed capital spending on infrastructure to plug the deficit, which has caused the construction industry and all companies operating in it to take a double-dip. I think this had greatly impacted the company I work for because of it being a public-sector firm.”
QS-4
“With limited public sector spending, our firm was trying to keep its head above water. But the falling support in government for a fiscal stimulus hit the company really hard, causing dropped profits and making it extremely difficult to maintain cash flow. The fiscal stimulus packages provided at the start of the recession allowed us some time to float, but within waning support, we were struck. Eventually, about two-thirds of our staff was cut or placed on part-time.”
QS-7P
“The entire economy and every sector and industry took a hit. No one was spared. But I believe the construction industry to a major… major hit! And we’re about to take another major hit because of the Brexit vote. The most relentless problem throughout the industry was with cash flows. You do a job, and you don’t get paid. You re-invoice your clients, but almost 4 to 6 months down the line that you were working for goes bankrupt. Business throughout the industry had dropped by 50 percent since the bust in 2007. Many companies ended up axing their strong workforce and placing building and land purchasing on hold.”
QS-8P
“It seems as if the entire industry had changed overnight. Many companies in the UK construction industry had to sit and think about how they were going to fund projects? How were they to sell? Who was going to buy, when, and at what rate were they going to buy? There was a huge gap to fill in terms of risk and reward. The industry was shaken, especially in the public sector. One of the ground realities that really hit the industry is similar to the Thames Gateway project. Many public companies began to wonder where the wealth generation of the project was going to come from, and if it was worth the risk based on the financial health of the private element in the project.”
Based on the interview responses, it seems that companies relying mostly on public works and government projects were hit majorly than compared to their private counterparts. Comments from QS-8P and others have alluded to the public most majority of clienteles for companies working in the public sector. Respondents were asked to comment on their company’s Recovery since the recession of 2008-2009. The following is some insight.
QS-1
“It’s a slow recovery, prolonged. We did begin to spring back up around 2011 and 2012. There was a greater resurgence of our revenues when we received the Cross Rails contract. That was a good sign. But it slow.”
QS-3
“Strides were made to protect projects and workers throughout the recession. We made new financing plans for our clients, which really did help to sustain the worst parts of the recession. Personally, I witnessed a recovery taking shape around late 2011 and early 2012. A lot of the projects that were delayed were rejuvenated. Many new clients came up on board. We really opened ourselves up to more foreign clients that wanted to contract out work in the local area. There was a job resurgence slightly but not much.”
QS-5P
“Our company’s Recovery started in late 2012. We began to see more projects in the infrastructure sector that we readily took up. Our company saw a greater profit with working in Scotland, especially with an increase in college projects there as the focus shifted on the use of PPP projects. That provided our company with a great boost. However, I’m a little skeptical now with the new government’s outlook towards public housing and the Brexit vote.”
QS-6P
“Recovery began for us around 2012. Our focus had shifted a great deal to infrastructure projects, and commercial projects also increased, particularly in London. Our cash flows were improving by early to mid-2013. There was a sigh of relief when we finally reached around 50 more people in late 2013. However, I’m afraid with the current political environment in the country that this Recovery will sustain. The construction industry and many firms took a large hit in 2008. And I’m afraid we may have to retake a large hit with the Brexit negotiations currently underway. One of the major players during the 2008 recession was the cost of materials and the cost of labour. There are striking similarities to these, starting up in 2016 when we voted to leave the EU. A majority of material and labour is obtained from migrant workers. Let’s see what happens.”
Quantity surveyors faced a lot of challenges during the 2008-2009 financial crisis. As discussed in the previous section, one of the main impacts of the recession was the difficulty in maintaining cash flows and a drastic drop in profits and turnovers. Many quantity surveyors attributed this to a main business challenge for the company. The next question asked wanted to explore how quantity surveyors had witnessed personal business challenges that may have been different from the companies. Quantity surveyors were also asked to detail how they overcame their personal challenges. Respondents were further asked to detail the main business challenges that their companies had faced. They were also asked to detail how their company was able to overcome or respond to these challenges. Some of the responses are detailed below.
QS-1
“Personally, the business challenge I faced most was attempting to stop project delays and cancellation. I usually focused on cost management techniques during the recession, focusing on comparative cost advice on alternative designs, materials, systems, and methods. I focused on keeping the cost down to satisfy clients in such testing times. Because of cash flow difficulties, the company that I worked for also emphasized reducing cost without hindering the construction project’s quality. ”
QS-4
“There were many challenges… personally, one major challenge I faced every day throughout the recession was to maintain composure for my team members. Especially at a time when pink slips were being distributed like free food. It was difficult at this time to keep the morale of my team up and focused. Many of the members of my team began working two jobs to support their families. But we did it. I overcame this challenge by being honest and devoted to team members. I worked vigorously with the highest level of our management to minimize the occurrence of downsizing. We were working on greater ad campaigns and expanded the sector that we worked. Even began looking for options to do business outside of the UK.”
QS-5P
“There are so many things that can go into answering this… My personal challenge was keeping our projects afloat, especially those that were nearing completion. This was especially challenging when we had to let go of a few of our project managers. This meant having to take on the duty of a project manager. I have done it before, but it was challenging when you knew financial resources and other capital was slowly depleting. I overcame this challenge by giving it my all as a project manager. Most quantity surveyors are essential to project managers, but it was very challenging in terms of ensuring that costs and contracts were kept in place.”
QS-7P
“My personal challenge was ensuring that the least amount of people are given the pink slip. It was hard seeing people you worked for, for so long be let go in such a shocking bust. But I worked with management to ensure that the least amount of personnel is let go. Those who were let go were provided with opportunities to be adjusted with affiliates or cooperative companies to ensure that they are not without work. For those that we kept, we ensured that they got training or were adjusted in part-time work.”
The current chapter analyses the data obtained from research instruments – questionnaires and semi-structured interview questions. The purpose of the analysis was to attempt to answer research questions that were developed in chapter one. The analysis has found key points in regards to the main impact experienced by construction companies during the financial crisis 2008-2009, business challenges, and steps taken to remedy or overcome the business challenges brought on by the 2008-2009 financial crisis. Both the questionnaire results and the interview questions have found that most of the respondents attributed the main impact of the financial crisis to a decline in revenues/turnover and difficulties in cash flows. The questionnaire results were analyzed using the relative importance index (RII) to ensure that the initial results’ descriptive statistics provide for some meaningful interpretations. The questionnaire’s RII results also brought forth the same impacts, business challenges, and steps to overcome business challenges. The interview data also provided in-depth information that the questionnaire was unable to provide. The interview results indicated that quantity surveyors had faced personal challenges in addition to the challenges they witnessed at their companies during the financial crisis in 2008-009. Many of the personal challenges included coping with the real-time events of the crisis related to subordinates and their relationship with the quantity surveyor. Many of the quantity surveyors indicated that due to cash flow, manyies a lot of staff had ed to aid the company in its financial difficulties arising from lack of work and decrease of workload. One of the main business challenges that resulted in many companies taking this step was project cancellations and project delays.
The current study had aimed to answer the following questions.
Using the following objectives for the study
Based on the previous chapter’s analysis, the current study was able to answer all of the research questions and the aim of the study. The current study has presented its results using a mixed-method research approach by combing quantitative and qualitative methods. Questionnaires were constructed using Likert scale principles. The purpose of the questionnaire was to measure quantity surveyors opinions in regards to the major impacts, business challenges, and steps to overcome business challenges that arose during the financial crisis of 2008-2009. Questionnaires were distributed via post-mail and uploaded online to Survey Monkey and distributed to 200 quantity surveyors across 20 construction companies in the U.K. (England). Major themes evident across the surveys were difficulties in maintaining cash flows during the economic downturn, the decline in revenues/turnover, and a decline in workload as major impacts found from the economic crisis.
Based on the descriptive statistics analysis, respondents’ main business challenges were increasing the company’s profitability during the economic crisis and dealing with the economic downturn and recession as a whole. On the other hand, the interviewees hadn’t expressed that dealing with the financial crisis was a major business challenge. All eight interviewees indicated that major challenges they witnessed in the construction business were the cancellation and delay of projects caused by a decrease in workload and a decrease in cash flows. The respondents taking the questionnaire probably believed it is best, to sum up, the business challenges using the option provided. Steps to remedy the business challenges were indicated in the descriptive statistics analysis of the questionnaire as cutting costs and overheads, encouraging staff to work part-time or taking unpaid leave, and increasing the amount of training given to employees to meet the challenges of the economic crisis. Interview respondents also indicated the same steps taken by the construction company.
To validate the results of the descriptive statistics, it was essential to perform another test conducted using the Relative Importance Index (RII) analysis. The analysis had provided a great deal of insight and aligned to an extent with the descriptive statistics of the questionnaire and the interviewees’ responses. The RII analysis concludes that the participants’ responses are coherent, which is strengthened with the questionnaire’s Cronbach alpha measure. Based on the interview data, the steps taken to meet the construction business’s challenges are akin to the RII analysis. In addition to cutting costs and using part-time work, respondents had indicated the need to work in other sectors and increasing efficiency/productivity. The interviewees had held the same view when describing the steps they took to meet personal and business challenges during the crisis. All eight of the quantity surveyors indicated a great emphasis on cutting costs through cost management methods. Their skill level and competence were extremely needed during the financial crisis.
The current study completed is seen as a preliminary study that provides a broad view of the experience that quantity surveyors faced during the financial crisis of 2008 and 2009. It did achieve the aim and objectives of the study set out in the beginning, but there is vast room for further Research. To divulge further into the subject area, there is a serious need for further research. As indicated in the interview data, many of the quantity surveyors predicted or hinted at another financial crisis or recession due to the vote to leave the European Union. Future researchers will need to study this specific point to understand the cause and effect relationship that recessions have on the construction industry and the wider national economy. Future researchers can use the current study as a point of reference for conducting their own research. The mixed-method approach was limited in the current study, but future Research can greatly build on the research approach. A greater number of quantity surveyors will need to be contacted and asked to participate in the study to provide more robust data on their experiences.
The current study is not without limitations; most of the limitations stem from limited time and financial resources to conduct research. Because of these limitations, the current study was only able to look at ten construction companies, five in the public sector and five in the private sector. Also, the current study was only limited to England. It was unable to look at other areas in the U.K. to develop a complete understanding of the impact the financial crisis had on the construction industry. Due to this lacking, the respondents of the current study were saturated in terms of individuals employed with only a specific set of organizations contacted. There is a probability that the respondents were influenced in their answer based on the business function of the organization they are employed for based on its culture, structure and governance. It is recommended that future studies focus on expanding their respondent pool and try and encompass more construction companies into their study.
Abidin, Z. N., Andros, N. A., and Hassan, H. 2014. Competitive strategy and performance of quantity surveying firms in Malaysia. Journal of Construction in Developing Countries 12(2), pp. 15-32.
Adebamowo, M. A., 2011. The implication of the global economic recession on sustainable housing in Lagos megacity. International Business Research 4(1), pp. 167- 175.
Alfred, O., 2007. Conflict of interest within construction practitioners: Quantity surveying, case study. Surveying and Built Environment, 18(1), pp. 35-50.
Andrew, S., and Halcomb, E. J., 2009. Mixed Methods Research for Nursing and Health Sciences. West Sussex, UK: Wiley-Blackwell.
Atkins Group. 2009. Global construction outlook for 2009. International Construction Intelligence 21(1), pp. 1-6.
BBC. 2009. House prices’ fall to 2004 level’. BBC News 2 January [online]. Available at: http://news.bbc.co.uk/2/hi/business/7807724.stm. [Accessed: 10 July, 2017].
Bem, D., 1995. Writing a Review Article. Psychological Bulletin 118, 172–177.
Brown, M., 2009. Recession causalities: Britain’s construction industry counts cost of boom-and-bust. The Telegraph [online]. Available at: http://www.telegraph.co.uk/finance/recession/5568068/Recession-casualties-of-Britains-construction-industry-count-cost-of-boom-and-bust.html. [Accessed: 13 July 2017].
Busch, M., 1993. Using Liker scales in L2 Research a researcher comments. TESOL Quarterly, 27(4), pp. 733-736.
Burger, P., Tyson, J., Karpowicz, I., and Coelho, M. D., 2009. The effects of the financial crisis on public-private partnerships. Department of Fiscal Affairs- International Monetary Fund, working paper 09/144.
Cacciatori, E. and Jacobites, M. G., 2005. The dynamic limits of specialization: Vertical integration reconsidered. Organization Studies 26(12), pp. 1851-1883.
Chiang, Y. H., Li, J., Choi, T. N. Y., Man, K. F. 2013. Evaluating construction contractors efficiency in Hong Kong using data envelopment analysis assurance region model. Journal of Facilities Management 11 (1), pp. 52-68.
Construction Industry Council (CIC). 2013. The impact of the recession on construction professionals. London: Sector Skills Council for Construction.
Cooper, H., 2003. Psychological Bulletin: Editorial. Psychological Bulletin 129, 3–9.
Creswell, J.W. & Vicki L. Plano Clark, 2011. Designing and Conducting Mixed Methods Research illustrated. SAGE.
Cronin, P., Ryan, F., and Coughlan, M., 2008. Undertaking a literature review: A step-by-step approach. British Journal of Nursing, 17(1), pp. 38- 43.
Department for Business Innovation and Skills (DBIS). 2013. U.K. construction- An economic analysis of the sector. London: Department for Business, Innovation and Skills.
DiCicco-Bloom, B., and Crabtree, B. F., 2006. The qualitative research interview. Medical Education, 40(4), pp. 314-321.
Dikmen, I., Birgonul, M. T., Ozorhon, B., Space, N. E., 2010. Using the analytic network process to assess business failure risks on construction firms. Engineering, Construction and Architectural Management 17(4), pp. 369-386.
Deakin, H., and Wakefield, K., 2013. Skype interviewing: Reflections of two PhD researchers. Qualitative Research, 14(5), pp. 603-616.
Denzin, N.K. & Lincoln, Y.S., 2011. The SAGE Handbook of Qualitative Research, SAGE.
Felstead, A., Green, F., and Jewson, N. 2012. An analysis of the impact of the 2008-09 recession on the provision of training in the U.K. Work Employment and Society, 26(6), pp. 968-986.
Fishman, B. S. (2008, November 30). Burning Down His House. New York Magazine, (December 8, 2008), 1–9.
Frei, M., 2010. The implication of the global financial crisis for the quantity surveying profession. International Cost Engineering Council Publications [online]. Available at: http://www.icoste.org/Frei.pdf [Accessed: 10 July 2017].
Hesse-Biber, S. N., 2010. Mixed Methods Research- Merging Theory with Practice. London: The Guilford Press.
Hesse-Biber, S., and Johnson, R. B., 2015. The Oxford Handbook of Multimethod and Mixed Methods Research Inquiry. New York, NY: Oxford University Press.
Henry, L., 2013. Intellectual capital in a recession: evidence from U.K. SMEs. Journal of Intellectual Capital 14(1), pp. 84-101.
Hennink, M., Hutter, I. & Bailey, A., 2010. Qualitative Research Methods illustrated., SAGE.
Hoxley, M., 2010. Built environment recession. Structural Survey 28(2),
Jensen, P. A., and Johannesson, E. I., 2013. Building information modelling in Denmark and Iceland. Engineering, Construction and Architectural Management 20(1), pp. 99-110.
Kollewe, J., 2011. Construction section insolvencies jump by nearly a fifth. The Guardian [online]. Available at: https://www.theguardian.com/business/2011/may/31/construction-industry-danger-recession. [Accessed: July 28 2017].
Latham, S., and Braun, M., 2011. Economic recessions, strategy, and performance: A synthesis. Journal of Strategy and Management 4(2), pp. 96-115.
Lim, B. T. H., Oo, B. L., and Ling, F. 2010. The survival strategies of Singapore contractors in a prolonged recession. Engineering, Construction, and Architectural Management 17(4), pp. 387-403.
Office of National Statistics (ONS). 2008. Housing in England 2006/07: A report based on the 2006/07 survey of English housing, carried out by the National Centre for Social Research. London: Department for Communities and Local Government.
Office for National Statistics (ONS). 2015. Output in the construction industry, August 2015 [online]. Available at: https://www.ons.gov.uk/ons/publications/re-reference-tables.html?edition=tcm%3A77-358530 [Accessed: 10 July 2017].
Ofori, G., and Toor, S. R., 2012. Role of leadership in transforming the profession of quantity surveying. The Australasian Journal of Construction Economics and Building 9(1), pp. 37- 44.
Onwuegbuzie, A.J. & Leech, N.L., 2007. A Call for Qualitative Power Analyses. Quality & quantity, 41(1), pp.105–121.
Palinkas, L.A. et al., 2015. Purposeful Sampling for Qualitative Data Collection and Analysis in Mixed Method Implementation Research. Administration and Policy in Mental Health, 42(5), pp.533–544.
Pirson, M., & Turnbull, S. (2011). Corporate Governance, Risk Management, and the Financial Crisis: An Information Processing View. Corporate Governance: An International Review, 19(5), 459–470.
Peston, R., 2008. The new capitalism. BBC Report, 8th December [online]. Available at: http://www.wtf.org.uk/documents/thenewcapitalism_001.pdf. [Accessed: July 10 2017].
Polet, D. F., and Beck, C. T., 2006. Essentials of Nursing Research: Methods, Appraisal, And Utilization. Philadelphia: Lippincott Williams and Wilkins.
Rostami, A., Sommerville, J., Wong, I. L., and Lee, C. 2015. Risk management implementation in small and medium enterprises in the U.K. construction industry. Engineering, Construction and Architectural Management 22(1), pp. 91-107.
Reips, U.-D. & Funke, F., 2008. Interval-level measurement with visual analogue scales in Internet-based research: VAS Generator. Behaviour research methods, 40(3), pp.699–704.
Sale, J.E.M., Lohfeld, L.H. & Brazil, K., 2002. Revisiting the Quantitative-Qualitative Debate: Implications for Mixed-Methods Research. Quality & quantity, 36(1), pp.43–53.
Saris, W.E. & Revilla, M., 2016. Correction for Measurement Errors in Survey Research: Necessary and Possible. Social indicators research, 127(3), pp.1005–1020.
Sonson, S. J., 2014. Quantity surveying role and environment influences in Saint Lucia. PhD Thesis, University of Salford.
Sofaer, S., 2002. Qualitative research methods. International Journal for Quality in Health Care, 14(4), pp.329–336.
Sorrell, J. M., and Redmond, G. M., 1995. Interviews in qualitative nursing research: Differing approaches for ethnographic and phenomenological studies. Journal of Advanced Nursing, 21(6), pp. 1117-1122.
Swedberg, R. (2010). The structure of confidence and the collapse of Lehman Brothers. In Markets on Trial: The Economic Sociology of the U.S. Financial Crisis: Part A (Vol. 30 Part A, pp. 71–114). Emerald Group Publishing Limited. https://doi.org/10.1108/S0733-558X(2010)000030A007
U.K. Construction Group. 2009. Construction in the U.K. economy- the benefits of investment. L.E.K. Consulting [online]. Available at: http://www.nasc.org.uk/NASC/files/ea/eabc21b4-91d3-4e44-8f0f-ab27a7a0a4b1.pdf. [Accessed: July 10, 2017].
Valencia, F., and Laeven, L., 2008. Systematic banking crises: A new database. IMF Working Papers, Working Paper No. 08/224. International Monetary Fund.
Williams, T., Bouchlaghem, D., Loveday, D., and Law, C., 2013. Principal contractor involvement in post-occupancy evaluation in the U.K. construction industry. Facilities 31(1/2), pp. 39-55.
Zhao, J. et al., 2014. A Comparison Between Respondent-Driven Sampling and Time-Location Sampling Among Men Who Have Sex with Men in Shenzhen, China. Archives of Sexual Behavior.
Section 1- Demographic Questions
| Questionnaire Item | SCALE | ||||
| Strongly Disagree | Disagree | Neither Agree or Disagree | Agree | Strongly Agree | |
| 1. The Great Financial Crisis of 2008-2009 had adversely impacted the company I was employed at the time. | 1 | 2 | 3 | 4 | 5 |
| 2. The main impact of the economic crisis on the business was less work/low demand. | 1 | 2 | 3 | 4 | 5 |
| 3. The main impact of the economic crisis on the business was cash flows difficulties. | 1 | 2 | 3 | 4 | 5 |
| 4. The main impact of the economic crisis on the business was project delayed or cancelled. | 1 | 2 | 3 | 4 | 5 |
| 5. The main impact of the business’s economic crisis was made redundancies/reduced staff numbers. | 1 | 2 | 3 | 4 | 5 |
| 6. The main impact of the business’s economic crisis was the loss of turnover/profits. | 1 | 2 | 3 | 4 | 5 |
| 7. The main impact of the economic crisis on the business was increased competition. | 1 | 2 | 3 | 4 | 5 |
| 8. The main impact of the economic crisis on the business was there were no specific impacts. | 1 | 2 | 3 | 4 | 5 |
| 9. The main business challenges of the economic crisis on the business were the need to increase workload/get more work | 1 | 2 | 3 | 4 | 5 |
| 10. The main business challenges of the economic crisis on the business were dealing with the economic downturn/recession. | 1 | 2 | 3 | 4 | 5 |
| 11. The main business challenges of the economic crisis on the business were getting paid. | 1 | 2 | 3 | 4 | 5 |
| 12. The main business challenges of the business’s economic crisis were finding qualified staff/suitably skilled staff. | 1 | 2 | 3 | 4 | 5 |
| 13. The main business challenges of the business’s economic crisis were the need to increase profitability. | 1 | 2 | 3 | 4 | 5 |
| 14. The main business challenges of the economic crisis on the business were no specific challenge. | 1 | 2 | 3 | 4 | 5 |
| 15. The main steps taken to meet the economic downturn’s challenges were cutting costs/overhead. | 1 | 2 | 3 | 4 | 5 |
| 16. The main steps taken to meet the challenges presented by the economic downturn was making redundancies. | 1 | 2 | 3 | 4 | 5 |
| 17. The main steps taken to meet the economic downturn’s challenges were seeking alternative work. | 1 | 2 | 3 | 4 | 5 |
| 18. The main steps taken to meet the economic downturn challenges were seeking work in other sectors. | 1 | 2 | 3 | 4 | 5 |
| 19. The main steps taken to meet the economic downturn’s challenges were increased advertising/marketing. | 1 | 2 | 3 | 4 | 5 |
| 20. The main steps taken to meet the economic downturn’s challenges were reduced working hours. | 1 | 2 | 3 | 4 | 5 |
| 21. The main steps taken to meet the economic downturn’s challenges were encouraging staff to work part-time or take unpaid leave. | 1 | 2 | 3 | 4 | 5 |
| 22. The main steps taken to meet the economic downturn’s challenges were spending more time looking for work. | 1 | 2 | 3 | 4 | 5 |
| 23. The main steps taken to meet the economic downturn’s challenges were increasing efficiency/productivity. | 1 | 2 | 3 | 4 | 5 |
| 24. The main steps taken to meet the economic downturn’s challenges were increasing the amount of training given. | 1 | 2 | 3 | 4 | 5 |
| 25. The main steps taken to meet the economic downturn’s challenges were no specific steps taken. | 1 | 2 | 3 | 4 | 5 |
Table 6- Total Item Statistics for Questionnaire
| Item-Total Statistics | ||||
| Scale Mean if Item Deleted | Scale Variance if Item Deleted | Corrected Item-Total Correlation | Cronbach’s Alpha if Item Deleted | |
| F.C. adverse impact | 72.4211 | 24.724 | .258 | .508 |
| impact: less work/demand | 72.8246 | 21.049 | .450 | -.134a |
| impact: cash flow difficulties | 73.7193 | 24.929 | -.019 | .672 |
| impact: project delayed/cancelled | 73.5175 | 24.305 | -.010 | .770 |
| impact: redundancies/reduced staff | 74.8246 | 27.314 | -.199 | .152 |
| impact: loss of turnover/profits | 72.7193 | 26.345 | -.069 | .475 |
| impact: increased competition | 74.3246 | 26.469 | -.117 | .606 |
| impact: no sig. impact | 75.0614 | 26.802 | -.142 | .798 |
| bc: increase workload/get more work | 74.0439 | 25.210 | .036 | .548 |
| bc: economic dt/recession | 73.0614 | 23.970 | .074 | .527 |
| bc: getting paid | 74.0439 | 23.848 | .229 | -.013a |
| bc: finding qualified staff/skilled staff | 74.9474 | 27.201 | -.194 | .513 |
| bc: increase profitability | 72.8421 | 23.798 | .171 | -.004a |
| bc: no specific challenge | 75.1754 | 25.456 | .043 | .448 |
| mc: cutting costs/overheads | 72.8246 | 26.889 | -.153 | .510 |
| mc: making redundancies | 74.3947 | 25.445 | .027 | .852 |
| mc: alternative work | 74.1491 | 27.137 | -.179 | .526 |
| mc: work in other sectors | 73.5702 | 22.725 | .246 | -.344a |
| mc: increased marketing/ads | 74.1140 | 24.633 | .136 | .619 |
| mc: reduced working hours | 73.7632 | 28.094 | -.280 | .551 |
| mc: part-time work/unpaid leave | 73.2807 | 24.416 | .000 | .563 |
| mc: more time looking for work | 73.7807 | 24.828 | -.014 | .770 |
| mc: increased efficiency/productivity | 73.2895 | 22.756 | .095 | .707 |
| mc: more training | 73.6053 | 24.206 | .075 | .729 |
| mc: no specific steps taken | 75.3860 | 26.328 | -.061 | .771 |
| a. The value is negative due to a negative average covariance among items. This violates reliability model assumptions. | ||||
If you are the original writer of this Dissertation and no longer wish to have it published on www.ResearchProspect.com then please:
The time to write an undergraduate full dissertation varies, but it typically takes several months, including research, drafting, and revisions.

All work is written by human writers. 100% AI free, guaranteed.

100% money back guarantee if you find plagiarism in our work.
COMPANY DETAILS


