Disclaimer: This is not a sample of our professional work. The paper has been produced by a student. You can view samples of our work here. Opinions, suggestions, recommendations and results in this piece are those of the author and should not be taken as our company views.
Type of Academic Paper – Dissertation
Academic Subject – Project Management
Word Count – 12915 words
With the increasing challenges encountered in residential renovation projects in Canada, adequate planning and management of project activities have become a key issue in the renovation project scheduling management now more than ever. In general, the renovation schedule planning and control’s primary objective is to ensure that the project is completed on time.
In this regard, Goldratt (1997) had introduced a technique for project control, known as the Critical Chain Project Management (CCPM). The CCPM comprises the employment of the Theory of Constraints (TOC), to project scheduling (Raz et al., 2003). Numerous successful application of the approach in construction projects has been reported in the literature (Ma et al., 2014). Critical Chain (CC), in a project, can be considered as the longest series of activities from different paths, linked by activities facilitated by common resources.
As Goldratt (1997) discussed, with CCPM, the focus changes from assuring the accomplishment of task approximations and midway achievements to guaranteeing the delivery time of a project. This calls for a mechanism referred to as buffer management, which safeguards Critical Chain Tasks (CCT), from risks by focusing on safety where required instead of dispersing or spreading it around.
The focused safety that safeguards the project delivery date from CC changes is known as the project buffer (Leach 2005). The focused safety directed to the areas where chains of non-critical work feed into a CCT is referred to as the feeding buffer.
The other important element of buffer management is known as the resource buffer, which has been defined by Wang (2011) as the resource alert mechanism that will guarantee that the resources are available when it is time to work on a CCT.
To enhance the usage and application of the CCPM approach in home renovation projects in Canada, the feeding and resource buffers are proposed in this study to augment the applicability of CCPM in residential project scheduling. This study further discusses the impact of feeding and resource buffers on Canadian home renovation projects.
In-home renovations tasks, especially in Canada, one of the main challenges in the project schedule planning and management is coming up with an accurate project schedule, particularly when the needed resources are scarce. Project managers have often used an approximated time to guarantee project delivery time.
For the past five decades, traditional scheduling approaches such as the Programme Evaluation and Review Technique (also known as PERT) Critical Path (also known as CPM), have been used to estimate project delivery time. However, these techniques remain far from being flawless because they flop in maximizing the project schedule performance, leading to wastage of resources. Goldratt (1997) came up with CCPM, which gives the concepts for effectively controlling project schedules.
Numerous studies have confirmed that the CCPM approach is increasingly being welcomed and used in various industries in Canada and worldwide (Ma et al., 2014). While the CCPM technique has widely been used in the Canadian Construction Sector, there have been no studies, to my knowledge, looking into evaluating the impact of feeding and resource buffers on the effectiveness of CCPM, particularly in Canadian home renovation projects. Given this, the purpose of this study is to close this lacuna by analyzing if the feeding and resource buffers can improve the effectiveness of CCPM in Canadian residential renovation projects.
It is expected that based on this study it would be possible to identify if the integration of feeding and resource buffers in CCPM can enable the development of a rigorous renovation plan that protects against unnecessary wastage of resources and reduces the possibility of renovation plan changes. Given this, the main research problem to be addressed in this study is to find out if the feeding and resource buffers can improve the effectiveness of CCPM in the Canadian residential renovation projects, in terms of successful completion of projects within specific resources.
This research aims to identify the impact of using feeding and resource buffers on the effectiveness of CCPM in terms of project control, accurate schedule, on-time completion, and unnecessary wastage prevention by conducting empirical research in Canadian home renovation projects.
This research is of theoretical significance as it focuses on identifying the impact of using feeding and resource buffers on the effectiveness of CCPM in Canadian home renovation projects, on which limited evidence exists in the present literature. This is also the unique feature of this work in that it is limited to the resource buffers and feeding buffers in CCPM only in the Canadian home renovation project set up.
So there is no attempt to deal with new residential building projects in this study. A presupposition has been made that the renovation operations are self-regulated and cannot be changed. Besides, it has also been presumed that resources are scarce. This is because if there could have been unlimited resources at disposal, then there would have been no need for buffers and that the outcomes of this project could have been irrelevant. However, it is not the case.
The Critical Chain Project Management (CCPM) and buffers in the CCPM are related to the Theory of Constraints (TOC). Therefore the theoretical literature related to the TOC, CCPM, and uses of different buffers in the CCPM is reviewed in this sub-section.
The TOC is a method by which the constraints in a process are identified, limiting the achievement of that process’s goal. The TOC application aims to improve the constraints so that they do not remain the limiting factors. The TOC is highly applicable in the manufacturing industry where removing or minimizing the constraint is of high importance to achieve successful completion of work.
There can be one constrain or even more than one. Nevertheless, the focus of TCO is to identify the constraint(s) so that the manufacturing process can be restructured to ensure the best utilization of the limiting resource. The TOC suggests employing buffers throughout the critical chain to prevent the delay due to limited resources. (Vanhoucke, 2012)
To ensure that the constraint is not starved, buffers are installed before the governing constraint. In addition to this, buffers are placed behind the constraint to avoid failure downstream, which occurs due to constraint output’s blocking. Buffers used in this manner protect the constraints from variations throughout the system as it allows the normal variation during the processing time.
Furthermore, buffers can also be classified as physical objects in a work centre in line to be processed in the centre. Buffers also help in buying time. The time before work reaches the constraint is known as time buffer. Thus, it is always recommended that there should be adequate work in the time queue before the constraint, and enough offloading space behind the constraint. (Griffin, 2010)
In a Kanban system, buffers are not the small queue of work usually present in a work centre; however, it is similar to the governing constraint. According to the theory, a prerequisite is a single constraint in the system, while all other parts of the system have an appropriate amount of capacity to keep up with the constraint work and catch up on the lost time.
As Kanban suggests, in a balanced line, when one work centre fails for a longer time period than the time period allowed by the buffer, only then the entire system should wait for the work centre to be restored. Under the TOC system, the situation wherein danger is involved, arises when the constraint is unable to process. This can occur due to malfunction, a hole in the buffer, or due to sickness. (Nicholas & Steyn, 2008)
This is why buffer management is known as one of the most vital aspects of the theory of constraints. There are various ways through which buffer can be applied. However, one of the most used methods is the visual system of designating buffer in three colours; green (represents ‘okay), yellow (denotes ‘caution), and red (points out ‘action required).
With such vast visibility, the entire system is enabled to align and subordinate the constraint need in a proper manner. This process can be worked on daily in the central operation room, accessible to everyone. (Martinelli & Milosevic, 2016)
Overall, the CCPM is based on the idea that almost all projects look like A-plants, i.e. every activity converts to a final deliverable. To protect this project, internal buffers are used to protect the synchronization points, and a final project buffer is used to protect the overall project.
The CCPM is based on TOC. It is a project scheduling and planning method that focuses on the resources needed for project completion and aims to develop accurate schedules for project completion. In the year 1997, Goldratt came forward with the idea of introducing the concept of CCPM. This application’s advantage is that it provides a more rapid service of up to 10% to 15% on achieving a successful project compared to traditional techniques such as CPM. Moreover, in the year 1998, the Standish Group explained how underutilization of the traditional project management only 44% completion was achievable on time for a particular project. The completion percentage originally planned for a project is 222%, whereby 189% is the planned original budgeted cost. However, due to inefficient planning, 70% of the projects fail to meet their deadlines while 30% represents those who are cancelled out before their completion time. Therefore, to solve this issue and deal with the traditional statistics, CCPM came into the process and improved performance. (Wei, Liu, & Tsai, 2002)
Furthermore, by using traditional project management tools, it was found that 30% of the time is wasted. Simultaneously, resources are inefficiently being used through ineffective methods such as Parkinson’s law, bad multitasking, lack of prioritization, student syndrome and in-box delays. Besides, to avoid a fall short in projects, projects need to have effective and efficient scheduling and planning, accompanied by a critical chain theory. Consequently, the critical chain consists of both precedence and resource dependence, enabling efficient resource allocation. Besides, a project’s critical chain is the same as its critical path method when its resources have unlimited quantities. Nevertheless, another option for the critical path analysis is the critical chain. (Leach, 2000)
The following are some characteristics that differentiate the critical chain from the critical path, and they are:
CCPM planning tries to make a total of the safety time, after which it is added into a buffer as a task within a project. The aim is to cater to the due-date performance by avoiding wastage of the safety time. Hence, this can be achieved by controlling poorly synchronized integration, student syndrome, bad multitasking, and Parkinson’s Law. (Leach, 2000)
To gain authorization towards the performance of a project, the critical chain management prefers to use buffer management rather than utilizing earned value management. Nonetheless, earned value management often appears confusing to project managers. This is because it encounters difficulty to differentiate the progression of the project constraint that is the critical chain from the progression of non-constraints on other paths. Additionally, the size of a project, feeding, and resource buffers can be determined via an event chain methodology. (Leach, 2014)
In planning a project, every task is delayed as much as possible while the process starts towards the end of the conclusion. Moreover, each task is followed by a certain time period. Nevertheless, there are some kinds of software development programs that take into consideration a second duration. This, in turn, is described firstly as one a “best guess” also known as 50% probability duration and secondly “safe” duration which normally has a higher probability of completion approximately 90% or 95% depending on how much risk-loving is the company. On the other hand, some other software developments have allocated some estimated time periods for every particular task. Thus, before storing the total tasks into the buffer, they tried to eliminate a given amount of fixed percentage. (Maylor, 2003)
Furthermore, by using the aggressive durations, the plan will be resourced level-wise, and hence, resources shall be allocated to each particular task. The critical chain takes place when identifying the longest sequence of resource-levelled tasks from start to finish has of a project has been done. Besides, a good reason to use the 50% estimates is that part of the project will end up early while the second part will end up late. This, in turn, will contribute to making overall the project’s variance zero. (Gray & Larson, 2002)
To control project schedules and financial performance, the CCPM makes use of “buffers”. Therefore, at the end of a project, the “extra” amount left on each particular task throughout the critical path and the difference between the “safe” durations and the 50% durations all together are stored in the buffer. Eventually, the critical chain is provided with a series of tasks in a sequential way. Thus, once this process comes towards its completion, it is being stored in the buffers. Hence, the delivery date of the external stakeholders is the date of completion of the project buffer. (Martinelli & Milosevic, 2016)
According to CCPM, the traditional CCPM adopts a certain time contingency to estimate each activity’s duration. According to this time buffer, the activity owner is guaranteed a certain safety level and a reasonable probability through which the task can be completed in the specified time. The mentioned survey reveals that this claim is true for many companies (Ribera, Sachon, & Grasas, 2003). Project managers agreed that incorporating buffers to a lot of activities covers the uncertainty of the project duration. In addition to this, two-thirds of the respondents spoke about the inclusion of certain extra buffers, functional managers, and project managers. When a project’s duration is extremely long, the buffers are reduced in the negotiation process; however, care is taken to keep adequate contingencies included in the ‘critical activities’. These activities involve high uncertainty and include activities that are not directly controlled by project managers and depend on third parties and clients. The word ‘critical’ used by practitioners strikes a resemblance in its meaning to ‘critical core’ which defines the set of activities as a part of the pacing project or within the range of being a pacing item. (Mascitelli, 2002)
Activities are fed into the critical chain in a project network. Each subpath contains a pooled buffer that represents the feeding buffer. This leads to the critical chain, which results in providing some slack to this chain as sown in figure 2.1 below. The complete pooled buffers shown in figure 2.1 are known as project buffers. The path of activities merging into the critical chain is known as a feeding chain. The project buffer is then included in the project schedule to protect the project deadline against changes in the critical chain. This critical chain should be protected against feeding chains. Thus, just like project buffers, feeding buffers are added to the project baseline schedule, once the feeding chain of the critical chain activity is added. (Wysocki, 2011)
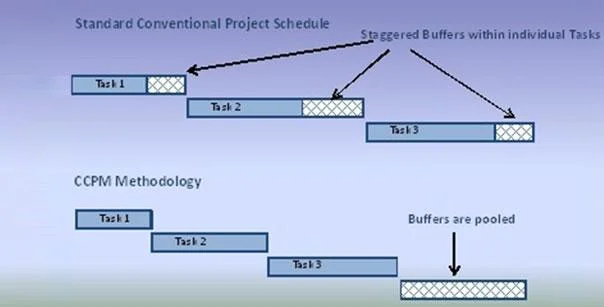
Figure 2.1
Orders completed by our expert writers are
Resource buffers are warning signals when a shift in resources in the critical chain occurs. Project buffers and feeding buffers act as mechanisms to move the removed safety time of the individuals to safety time buffers, whereas, resource buffers are warning signs through which the timely availability of project resources is assured.
Resource buffers are also set alongside the critical chain to ensure that the renewable resources are available for work on the critical chain when and as required. Moreover, a warning sign in the resource buffer is added whenever an activity requires a renewable resource that has not been used by the previous activity. (Wysocki, 2011)
Even though TOC and CCPM have received a lot of attention, certain basic principles are only available through the proper use of critical path method scheduling, along with resource levelling and loading. Wilkens (2000) explains the use of buffers in CCPM and their role to protect the project and decrease the impact of feeding paths on the critical path. In addition to this, the buffers’ traditional CPM scheduling are equivalent.
Constant replanning and analysis are required throughout the project as they mature and get complex in nature. Also, it becomes difficult for CCPM or CPM to manage feeding paths. Adding resource buffers and time to the schedule reaps no benefits. Thus, resource and float levelling is used within the traditional CPM framework (Wilkens, 2000).
Tenera & Machado (2007) presented a comparative study that revealed the effects of specific ordinary time buffers and their sizing methods, usually used in critical chain project management scheduling.
For buffer sizing, a new approach was developed, and the performance of which was compared with current methods. This method uses the latest software applications. According to the simulation tests, this new approach offered shorter project durations with better project planning. Also, the real-world method’s applicability was tested in the Portuguese construction industry as a case study.
Leus & Herroelen (2001) conducted empirical research based on the advantages and drawbacks of critical chain scheduling. Critical chain Scheduling and Buffer Management (CC/BM) is the direct application of the Theory of Constraints (TOC) to project management. It is now known as one of the most popular and useful approaches to project management.
The scheduling mechanism of CC/BM is tested in a complete experiment performed in benchmark problems. A 50 per cent rule for buffering sizing leads to overestimation issues of the required buffer protection, thus updating the baseline schedule regularly is essential.
Also, keeping the critical chain in line with the updation will help in yielding the best results. Accurate and appropriate intermediate estimates of the final project duration can also be provided. Using rescheduling and scheduling mechanisms of the project, such as branch and bound, will positively impact the final deliverable project (Leus & Herroelen, 2001).
According to Leonarda (2015), CCPM is a new scheduling method. It has many advantages over the traditional methods; however, it is still far from being the perfect method. According to the study, many researchers are more concerned about the project and feeding buffer size. Thus, this study does not take into account resource buffers.
This is a huge gap in this research as the resources needed to perform tasks and resource buffers, protect the critical activities from resources’ unavailability. In this study, a simulation was performed on three projects which were generated by range software. Each project contained the same network strength characteristics, resource strength, and resource use.
However, three different types of buffer sizes and three varying uncertainty levels were applied to the schedules. Results of simulation analysis demonstrate that no optimum resource buffer can be achieved for projects. Even if there are some projects with the same characteristics, they behave differently.
The research outcomes point out that the resource buffers cannot be ignored and should always be simulated through the CCPM schedules. These help in the reduction of the total project duration in the execution stages. Also, the decision if the resource buffer should be applied or not should be a financial decision, i.e. the decision should be taken based on cost-benefit analysis (Leonarda, 2015).
Barnes, Raz, and Dvir (2003) suggest that CCPM is a new and fresh approach to project management. This approach is an extension of the TOC explicitly designed for project environments. Irrespective of the application, the initialling point of CCPM is a task list that contains their dependencies and duration estimates.
The first step includes developing the initial project tasks schedule; the second step included recalculating the project schedule based on shortened task duration estimates. While at the second step, a close look at the material buffers and bottlenecks’ concepts must be taken. Any company that considers the adoption of CCPM should consider the primary sources of the cost before applying the concept. In this manner, unnecessary problems will be avoided (Raz, Barnes & Dvir, 2003).
Construction projects require a wide range of constraints. These include resource scarcity, project complexity, and duration uncertainty. CCPM is now a well-known construction scheduling method. Wang (2011) presented a framework to improve the implementation of CCPM in the construction project industry.
The context talks about two main challenges in CCPM based construction scheduling, i.e. multiples resource levelling and buffers size. To ensure successful schedule management, buffers play a considerable role.
On the other hand, barriers that are generated by the existing sizing methods are either unnecessarily large of insufficiently robust. Resource levelling is another challenge in CCPM based construction scheduling as it needs an entirely different approach used in traditional scheduling methods. Under this framework, buffer sizing is improved by integrating buffer sizing through various uncertainties.
These uncertainties are evaluated in five dimensions with their associating metric in the framework. The structure also talks about the feasibility of multiple resources levelling in the same CCPM based construction scheduling along with a novel method that trades off between the resource usage and activity duration. The whole process is based on a multimodal activity execution structure.
Wang (2011) evaluated and analyzed three case studies in his research. According to the results, the proposed framework performed exceptionally well than existing buffer sizing methods. The results also proved to be feasible and effective while playing multiple resources levelling in CCPM based construction schedule.
The research was conducted by Ribera, Sachon & Grasas (2003) to analyze the basic concepts of CCPM. A few of these concepts are as old as four decades; however, compared to traditional project management, CCPM is hugely successful in practice, even though more research is required to evaluate the impacts of different elements. In a set of simulation experiments, it has been found that a few concepts are critical as compared to others.
For example, the transparency of the individual time activity contingency is essential compared to the definition of the buffer to allocate the same at the end of the chain. The same problem exists with time buffers, i.e. they are not transparent.
The activity owner does not disclose the part of the total time correspondence to the expected activity duration. In addition to this, the rationale behind buffers is not clear; therefore, it becomes difficult to manage them at the project level. Thus, the existence of these hidden buffers favours loud behaviour during the project execution phase.
Considering the project overload, the initial behaviour is known as ‘students’ syndrome’. This consists of using the buffer before initiating the activity, i.e. only those activities that will be initiated that are late. The second behaviour focuses on the finished activity as planned, even though buffer guarantees new finishes.
The activity owner considers the buffer as his safeguard against the uncertainty of tasks. The owner does not want to show that the buffer might not be needed in a few cases. Also, the owners do not expect the buffer to finish earlier than planned, and they do not accept the fact that an activity can finish before time once in a while (Ribera, Sachon & Grasas, 2003).
Literature relating to and focusing on CCPM does not create a difference between the technological uncertainty of activity and the possible delay due to various reasons. This delay can occur due to the waiting time in the queue for the resources.
In cases of a single project or low uncertainty regarding the duration of the execution, the resource levelling phase eliminates most of the queuing impact. In addition to this, when resources are being used between different projects for multitasking, the execution time might increase. According to researches, it is inappropriate to handle queuing time via buffer during uncertainties.
Traditional network queuing concepts limits the number of active projects that are more useful. The idea of multitasking resources in CCPM is not liked by many, as they believe that activities should start as soon as the predecessor activities are over.
However, it has been found that in practice, multitasking is quite common during significant periods of idleness, which occurs due to the dependency of certain activities regarding party resources. In addition to this, there is a need to change activities that encourage creativity in certain developmental projects (Anavi-Isakow & Golany, 2003).
The following are the developed hypotheses based on the reviewed empirical literature.
H1: The feeding buffers can have a significant positive impact on the effectiveness of CCPM.
H2: The resource buffers can have a significant positive impact on the effectiveness of CCPM.
The duration of the chain of tasks feeding critical tasks is set to a certain percentage known as feeding buffers. In a nutshell, these are the safety times added to the project to account for the delays in time. These ensure effective project scheduling and management.
These are the resource alert systems that ensure the resources are ready when working on a critical chain task. As opposed to feeding buffers, these buffers are not cherished times added to the project, and they also do not impact the time elapsed of a particular project.
In this study, the impact of these variables on the effectiveness of CCPM was analyzed. Based on the theoretical argument, these two variables are likely to improve the efficiency of CCPM.
The effectiveness of CCPM is defined as a critical chain project management that is effective in terms of; on-time completion, unnecessary wastage prevention, and successful completion within specific resources.
Following is the research model, which is developed based on the hypotheses.
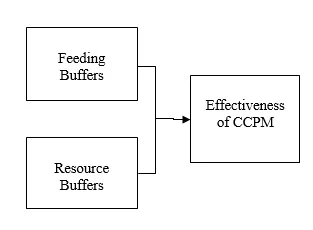
The interaction between the two independent variables, namely; feeding buffers and resource buffers with the dependent variable, the effectiveness of CCPM is positive. Meaning the increase in the use of feeding buffers and resource buffers in CCPM should increase the effectiveness of CCPM.
The Multiple Regression Analysis (MRA) is used as an econometric method to measure feeding and resource buffers’ impact on CCPM effectiveness. The significance of the selected independent variables is tested at a 95% confidence interval.
Two data sources are used in this study, namely; primary data and secondary data. The primary data source was necessary to use in this study to collect quantitative data from a sample of homes renovation project managers of Canada. Primary data was collected via conducting a survey using closed-ended and structured questionnaires based on the Likert point scale (Field, 2013).
However, secondary data was also necessary to collect in this study to review past research and identify the literature related to the research problem. The sources from where secondary data is collected are referred to as secondary sources (Saunders, Lewis, & Thornhill, 2015).
Secondary data include all the information that can be assessed without conducting any primary research and is generally assessable as secondary data can be collected from secondary sources without performing any survey, so secondary data collection is also referred to as desk research.
The secondary data sources may include several causes such as; published and electronic research journals, research articles, books, newspaper articles, online databases, and other information available online on the World Wide Web. In this present study, the secondary data was gathered from various secondary sources, including online and published sources (Bryman & Bell, 2015).
While selecting the secondary data sources, it was ensured to only include reliable sources. Thus secondary data sources that may not be safe, such as blogs were not selected. The sources from which secondary data was collected in this research include online and printed books, electronic and published research journals, reliable websites, research reports, and organizations and companies’ publications.
The target population in this study was the total number of renovation project managers exist in Canada. As it was not possible to include the entire target population in this study, therefore it was necessary to collect a smaller representative sample. As per Sekaran and Bougie (2016), in primary research, it is appropriate to select a research sample that comprises more than 30 respondents (Sekaran & Bougie, 2016).
Therefore in this study, an example of 70 renovation project managers from Canada was selected as the research sample to collect primary data to identify the impact of feeding and resource buffers on CCPM effectiveness.
The quantitative data were analyzed using descriptive statistics, correlation matrix, and regression analysis, where the effects of feeding and resource buffers on CCPM effectiveness was analyzed using regression analysis. Moreover, as the primary quantitative data was collected from a representative sample and collected by surveying at a specific point in time, the data was cross-sectional. (Collis & Hussey, 2009)
Data filtering involves data reduction and refining to exclude unreliable, incomplete, redundant, or irrelevant data or variables from the data set. It may include digital data transformation, whereby the data is simplified and reorganized into an empirically improved form, which can bring results with improved reliability and are free from errors.
Thus data filtering is an essential element in research that enables the research to improve outcomes by removing incomplete or unreliability data. The data filtering helps enhance the results of statistical analysis, such as regression because regression analysis can bring more accurate results when applied to the reduced data set.
Different techniques can be used in empirical research for quantitative data reduction such as; a test of completeness, reliability analysis, and dimension reduction (using discriminant analysis). The proof of integrity enables the researchers to exclude or ignore such data from the data set, which is incomplete or missing. So only the data which is complete are included in the analysis. However, the reliability analysis enables the researchers to exclude those variables from the data set, which can reduce the test re-test reliability of the results.
By exclusion of the unreliable variable(s) from the analysis, the data reduction is achieved. This study test of completeness and reliability analysis was performed using Statistical Package for the Social Sciences (SPSS) to filter unreliable variables. The value of Cronbach’s Alpha was used to test the reliability, where the variables with Cronbach’s Alpha value of 0.7 or above were considered reliable.
The result outputs of the reliability analysis are provided in Appendix II. The results suggested that the data has excellent reliability as its Cronbach’s Alpha value was 0.916, which means that the data is appropriate for further analysis and can provide results with 91.6% reliability.
In research, data management involves how the data is collected, recorded, protected, reorganized, processed, and presented. In this study, the information was collected from primary and secondary data sources. Therefore while collecting primary and secondary data, it was ensured to address the ethical aspects necessary to consider while collecting data.
In this regard, before collecting primary data, fully informed consent was obtained from the participants. They were informed about the purpose of this study and the intended use of any information they provide. Besides, formal approval was obtained from the participants regarding their willingness to participate in the study. It was also communicated to the participants that their identities will be kept anonymous.
On the other hand, while collecting the secondary data, it was ensured to avoid plagiarism by adequately paraphrasing the reviewed literature. The original author(s) of the novel was acknowledged by using in-text citation or reference.
Moreover, the collected data was then recorded and protected by using password-protected and encrypted files. Their privacy and personal information, such as names and email addresses, were kept confidential and protected. Furthermore, during this research, the data recorded on hard copies were stored in a locked cabinet to ensure protection. The primary quantitative data was reorganized in MS Excel files, and then it was processed using SPSS and was presented in the form of output results for data analysis.
In quantitative data, outliers are those observations in a data set representing extreme values and are greatly distant from other observations in the data set. The outliers due to their extremeness can influence statistical analysis results, such as regression, resulting in impacting the fitness of the regression model on the data set.
Therefore in quantitative research, it is highly essential to reduce the influence of outliers to ensure that outliers do not influence regression analysis results. In this present study, the influence of outliers was reduced using Likert-type scale-based items (questions) in the questionnaire to collect quantitative data. According to Van den Broeck, Cunningham, Eeckels and Herbst, (2005), if the Likert scale is used to collect data, then no outliers will exist in the collected data.
For instance, when 5 points Likert scale is used then, the respondents have five answer choices (1, 2, 3, 4, and 5), and any extreme value other than these five answer choices are not recognized as valid observation and are considered missing and excluded from the analysis.
Therefore in this study, 5 points Likert scale was used to collect data, whereby the influence of such extreme values on the results was reduced. The summary statistics indicate that the five answer choices under 5 point Likert-scale are denoted as follows; 1 = completely disagree, 2 = somewhat disagree; 3 = neither agree nor disagree; 4 = somewhat agree; 5 = completely agree.
In this study, the quantitative data of the questionnaire was, first of all, analyzed using descriptive statistics. The descriptive statistics were performed to identify the central tendency and frequency distribution of the questionnaire data. Based on the data’s mean values, the average response of the renovation project managers was identified, and the complete result outputs are provided in Appendix III, and summarized results are given below in table 4.1.
Table 4.1 Descriptive Statistics
| Description | Mean |
| What is your age group? | 2.81 |
| From how many years you have been working as a renovation project manager? | 2.81 |
| The effectiveness of CCPM can be achieved if feeding and resource buffers are used in CCPM | 4.49 |
| The effectiveness of CCPM can be achieved if projects are completed on time | 4.46 |
| The effectiveness of CCPM can be achieved if unnecessary wastage is protected | 4.53 |
| The effectiveness of CCPM can be achieved if projects are completed within specific resources | 4.53 |
| If extra time is added to each activity on a critical chain in CCPM, it is possible to prevent idle time (loss of work) due to time delays | 4.49 |
| Projects can be completed on time if safety times are added to the critical chain in projects | 4.01 |
| Feeding buffers can help in making accurate project schedules | 4.49 |
| If resource buffers are added to each activity on a critical chain in CCPM, it is possible to prevent idle time (loss of work) due to resource shortage | 4.13 |
| Unnecessary wastage can be prevented if extra (buffers) resources are added to the critical chain in projects | 4.63 |
| Resources shortfalls can be avoided if extra (buffers) resources are added to the critical chain in projects | 4.53 |
Based on the results of descriptive statistics, the respondents’ average age group was found to be 2.81, which represented the age group between 41 to 50 years. Similarly, the responding renovation project managers’ average working experience was found to be 2.81, which represented 11 to 15 years of working experience.
Moreover, the average response regarding the use of feeding and resource buffers in CCPM to achieve the effectiveness of CCPM was 4.49, which represented that on average, the respondents were strongly agreed with the statement.
The average response for the statement that the effectiveness of CCPM can be achieved if projects are completed on time was 4.46, which represented that the respondents strongly agreed with the statement on an average. Furthermore, the average response for the statement that the effectiveness of CCPM can be achieved if unnecessary wastage is protected was found to be 4.53 which also represented the respondents’ strong agreement with the statement on an average.
Similarly, the respondents’ remaining answers for the Likert scale base questions/statements were more than 4 on an average, which represents that the respondents on average were either agreed or strongly agreed with the questions/statements.
The mean values’ results provided useful information to identify the average responses of the renovation project managers. However, to better understand the majority of the respondents’ frequency distribution analysis was also performed on the data.
The frequency distribution analysis was performed to know the respondents’ level of agreement or disagreement with the questions/items of the questionnaire, where the opinion of the majority was identified based on the most repeated answers. The results output tables of the frequency distribution analysis are provided in Appendix III, while the summarized results are provided in tables 4.2 to 4.6, respectively.
In section 1 of the questionnaire, there were 3 questions (from questions 1 to 3) related to the respondents’ demographics. The frequency distribution analysis results for questions 1, 2, and 3 are given below in table 4.2.
Table 4.2 Demographics
Q1. Your gender
Male 65.7%
Female 34.3%
Q2. What is your age group?
20 to 30 years 4.3 %
31 to 40 years 30 %
41 to 50 years 45.7 %
More than 50 years 20 %
Q3. From how many years have you been working as a renovation project manager?
Less than five years 2.9 %
5 to 10 years 37.1 %
11 to 15 years 41.4 %
More than 15 years of 21.4 %
Question 1 was focused on identifying the gender of the respondents. It was found that 65.7 % of the responding renovation project managers were males, while 34.3 % of the renovation project managers were females. This indicated that the majority of the renovation project managers were males. However the question 2 was focused on identifying the age group of the responding renovation project managers.
Four answer choices were given in this question. Based on the results given in table 4.2 below it was found that 4.3 % of the renovation project managers were between 20 to 30 years of age, 30 % were between 31 to 40 years of age, 45.7% were between 41 to 50 years of age, and 20% were more than 50 years of age. This indicates that most of the respondents were between 31 to 50 years of age, representing middle-aged renovation project managers.
Question 3 was focused on finding out the years of experience of the responding renovation project managers in this research. There were four answer choices given to them to indicate how many years they worked as a renovation project manager. Based on the results, 2.9 % of the renovation project managers have been working as renovation project managers for less than five years, while 37.1 % have been working from 5 to 10 years, and 41.1 % have been working from 11 to 15 years.
However, 21.4 % have been working as renovation project managers for more than 15 years. This indicates that most of the responding renovation project managers had 5 to 15 years of working experience as renovation project managers in Canadian home renovation projects.
This finding tells us that most of the responding renovation project managers were quite experienced and have sufficient knowledge about the Canadian home renovation projects to provide useful information for this research.
In section 2 of the questionnaire, there were two questions (questions 4 to 5) focused on identifying if the renovation project managers were aware of the concept of CCPM, and feeding buffers and resource buffers. The results of frequency distribution analysis for questions 4 and 5 are given below in table 4.3.
Table 4.3 CCPM, feeding buffers, and resource buffers
Q4. Do you understand what Critical Chain Project Management (CCPM) is?
Yes 100 %
No 0 %
Q5. Do you understand what are feeding buffers and resource buffers and how they can be used in CCPM?
Yes 100 %
No 0 %
In question 4, the renovation project managers were asked if they understand what Critical Chain Project Management (CCPM) is. As shown in the table above, 100 % of the respondents had stated yes, 0 % stated no, which indicates that most of the respondents understood the concept of CCPM.
Similarly, in question 5, the renovation project managers were asked if they understand feeding buffers and resource buffers and how they can be used in CCPM. All of the respondents had selected yes, which indicates that 100 % of the renovation project managers understood the concepts of feeding buffers and resource buffers and how they can be used in CCPM.
In section 3 of the questionnaire, there were 4 questions (question 6, 7, 8 and 9), which focused on identifying the level of agreement or disagreement of the respondents related to the dependent variable’ effectiveness of CCPM’. The frequency distribution analysis results for questions 6, 7, 8, and 9 are given below in table 4.4.
Table 4.4 Effectiveness of CCPM
Q6. The effectiveness of CCPM can be achieved if feeding and resource buffers are used in CCPM.
Strongly disagree 2.9 %
Disagree 1.4 %
Neither agree nor disagree 2.9 %
Agree 30 %
Strongly agree 62.9 %
Q7. The effectiveness of CCPM can be achieved if projects are completed on time.
Strongly disagree 0 %
Disagree 4.3 %
Neither agree nor disagree 8.6 %
Agree 24.3 %
Strongly agree 62.9 %
Q8. The effectiveness of CCPM can be achieved if unnecessary wastage of resources is protected.
Strongly disagree 0 %
Disagree 4.3 %
Neither agree nor disagree 4.3 %
Agree 25.7 %
Strongly agree 65.7 %
Q9. The effectiveness of CCPM can be achieved if projects are completed within specific resources.
Strongly disagree 0 %
Disagree 5.7 %
Neither agree nor disagree 1.4 %
Agree 27.1 %
Strongly agree 65.7 %
In question 6, the respondents were enquired about the extent to which they agree or disagree that the effectiveness of CCPM can be achieved if feeding and resource buffers are used in CCPM. The frequency distribution analysis results depicted that 2.9 % of the respondents were strongly disagreed, 1.4 % disagreed, 2.9 % were neither agreed nor disagreed.
In comparison, 30 % were agreed, and 62.9 % were strongly agreed with the statement. This suggested that the majority (31 % + 62 % = 93 %) of the respondents agreed that the effectiveness of CCPM could be achieved if feeding and resource buffers are used in CCPM.
Subsequently, in question 7, the respondents were enquired about the extent to which they agree or disagree that the effectiveness of CCPM can be achieved if projects are completed on time. It was found that 0 % of the respondents were strongly disagreed, 4.3 % was disagreed, while 8.6 % were neither agreed nor disagreed.
However, 24.3 % were agreed, and 62.9 % were strongly agreed with the statement. So the majority of the renovation project managers agreed that the effectiveness of CCPM could be achieved if projects are completed on time.
Question 8 was focused on identifying the respondent’s level of agreement or disagreement with the statement that the effectiveness of CCPM can be achieved if unnecessary wastage of resources is protected. It was found that 0 % of the respondents were strongly disagreed, 4.3 % disagreed, and 4.3 % were neither agreed nor disagreed.
However, 25.7 % were agreed, and 65.7 % were strongly agreed with the statement. This reflects that most of the respondents believed that the effectiveness of CCPM could be achieved if unnecessary wastage of resources is protected. In simple words, by preventing the waste of resources, it is possible to achieve the effectiveness of CCPM.
Moreover, in question 9, the respondents were asked to express the extent to which they agree or disagree that the effectiveness of CCPM can be achieved if projects are completed within specific resources. Based on the results, it was evident that 0 % of the respondents were strongly disagreed, 5.7 % was disagreed, while 1.4 % were neither agreed nor disagreed.
However, 27.1 % were agreed, and 65.7 % were strongly agreed with the statement. This highlighted that the majority of renovation project managers agreed that the effectiveness of CCPM could be achieved if projects are completed within specific resources.
In section 4 of the questionnaire, there were 3 questions (from 10 to 12) related to the independent variable, ‘feeding buffers’ in CCPM. The frequency distribution analysis results for questions 10, 11, and 12 are given below in table 4.5.
Table 4.5 Feeding buffers
Q10. If extra time is added to each activity on a critical chain in CCPM, it is possible to prevent idle time (loss of work) due to time delays.
Strongly disagree 0 %
Disagree 1.4 %
Neither agree nor disagree 10 %
Agree 27.1 %
Strongly agree 61.4 %
Q11. Projects can be completed on time if safety times are added to the critical chain in projects.
Strongly disagree 0 %
Disagree 10 %
Neither agree nor disagree 22.9 %
Agree 22.9 %
Strongly agree 44.3 %
Q12. Feeding buffers can help in making accurate project schedules.
Strongly disagree 0 %
Disagree 4.3 %
Neither agree nor disagree 5.7 %
Agree 27.1 %
Strongly agree 62.9 %
In question 10, respondents were asked to state the level to which they agree or disagree that if extra time is added to each activity on a critical chain in CCPM, it is possible to prevent idle time (loss of work) due to time delays.
The results showed that 0 % of the respondents were strongly disagreed, and 1.4 % disagreed, while 10 % were neither agreed nor disagreed. However, 27.1 % were agreed, and 61.4 % were strongly agreed with the statement. Therefore, most of the renovation project managers agreed that by adding extra time to each activity on a critical chain in CCPM, it is possible to prevent loss of work due to time delays.
Afterwards in question 11, the respondents were enquired about the level to which they agree or disagree with the statement that the projects can be completed on time if safety times are added to the projects’ critical chain. It was found that 0 % of the respondents were strongly disagreed, 10 % disagreed, and 22.9 % were neither agreed nor disagreed.
However, 22.9 % were agreed, and 44.3 % were strongly agreed with the statement. This reflects that most of the respondents believed that projects could be completed on time if safety times are added to the critical chain in projects.
In question 12, respondents were asked to state to what extent they agree or disagree that feeling buffers can help make accurate project schedules. The frequency distribution analysis results depicted that 0 % of the respondents were strongly disagreed, 4.3 % disagreed, and 5.7 % were neither agreed nor disagreed.
In comparison, 27.1 % were agreed, and 62.9 % were strongly agreed with the statement. This suggested that most respondents thought that feeling buffers could help make accurate project schedules.
In section 5 of the questionnaire, there were 3 questions (questions 13, 14, and 15) related to the independent variable ‘resource buffers’ in CCPM. The frequency distribution analysis results for questions 13, 14, and 15 are given below in table 4.6.
Table 4.6 Resource buffers
Q13. If resource buffers are added to each activity on a critical chain in CCPM, it is possible to prevent idle time (loss of work) due to resource shortage.
Strongly disagree 0 %
Disagree 2.9 %
Neither agree nor disagree 27.1 %
Agree 24.3 %
Strongly agree 45.7 %
Q14. Unnecessary wastage of resources can be prevented if extra (buffers) resources are added to the projects’ critical chain.
Strongly disagree 0 %
Disagree 1.4 %
Neither agree nor disagree 4.3 %
Agree 24.3 %
Strongly agree 70 %
Q15. Resources shortfalls can be avoided if extra (buffers) resources are added to the projects’ critical chain.
Strongly disagree 0 %
Disagree 4.3 %
Neither agree nor disagree 1.4 %
Agree 31.4 %
Strongly agree 62.9 %
In question 13, the respondents were asked to state the level to which they agree or disagree if resource buffers are added to each activity on a critical chain in CCPM. It is possible to prevent idle time (loss of work) due to resource shortage.
The results showed that 0 % of the respondents were strongly disagreed, 2.9 % disagreed, 27.1 % were neither agreed nor disagreed, while 24.3 % were agreed, and 45.7 % were strongly agreed with the statement. This indicated that most of the respondents agreed that by adding resource buffers to each activity on a critical chain in CCPM, it is possible to prevent loss of work due to resource shortage.
In connection with the previous question, in question 14 the respondents were enquired about the extent to which they were agreed or disagreed with the statement that unnecessary wastage of resources can be prevented if extra (buffers) resources are added to the critical chain in projects.
It was found that 0 % of the respondents were strongly disagreed, 1.4 % disagreed, 4.3 % were neither agreed nor disagreed, while 24.3 % were agreed, and 70 % were strongly agreed with the statement. Therefore, because of most of the renovation project managers, the unnecessary wastage of resources can be prevented if buffers’ resources are added to the projects’ critical chain.
In question 15, the respondents were asked to state the extent to which they agree or disagree that resource shortfalls can be avoided if extra (buffers) resources are added to the critical chain in projects.
Based on the results, 0 % of the respondents were strongly disagreed, 4.3 % disagreed, 1.4 % were neither agreed nor disagreed, while 31.4 % were agreed, and 62.9 % were strongly agreed with the statement. This highlighted that most of the respondents believed that resource shortfalls could be avoided if extra (buffers) resources are added to the critical chain in projects.
The correlation analysis was performed to find the relationship between the effectiveness of CCPM with feeding buffers and resource buffers. The complete results output of correlation analysis is provided in Appendix IV, while the summarized results are provided in table 4.7, which is given below.
As the correlation was significant at the 0.01 level, it means that at 99% confidence level; the independent variables namely; feeding buffers and resource buffers were found to have a significant positive correlation with the effectiveness of CCPM as their respective sig. Values of the two were independent variables were (0.000) respectively, which was less than (0.01).
It means that the effectiveness of CCPM is directly related to; feeding buffers and resource buffers. Moreover, both the independent variables were found to have a strong relationship with the effectiveness of CCPM as their Pearson Correlation values were (0.787) and (0.736) respective were more than 0.7.
Table 4.7 Correlation Matrix (N=70)
| Effectiveness of CCPM | |||
| Pearson Correlation | Sig. (2-tailed) | Correlation | |
| Feeding buffers | .787 | .000 | Significant Positive |
| Resource buffers | .736 | .000 | Significant Positive |
Correlation is significant at the 0.01 level (2-tailed)
The multiple regression analysis was performed to identify the impact of feeding buffers and resource buffers on the effectiveness of CCPM. Two hypotheses (H1 and H2) of this study were tested based on the results of the multiple regression analysis to find out which of the two independent variables (namely; feeding buffers and resource buffers) have a significant positive impact on the dependent variable (effectiveness of CCPM). The regression analysis results are summarized in Table 4.8 below, while the SPSS results outputs are given in Appendix V.
Table 4.8 Multiple Regression Analysis (N=70)
| Description | Adjusted R2 | Significance | β | Impact | ||
| Regression Model (ANOVA) | 0.691 | 0.000 | ||||
| Feeding buffers | 0.000 | 0.633 | Significant Positive | |||
| Resource buffers | 0.000 | 0.536 | Significant Positive | |||
| Predictors (Independent Variables): Feeding buffers, Resource buffers
Dependent Variable: Effectiveness of CCPM |
||||||
At a 95 % confidence interval, the significance value (p-value) of the regression model based on ANOVA was found to be (0.000) which was less than 0.05, as shown in the above table. This suggested that the model equation was significantly fitted on the data set.
Moreover, the adjusted R2 value was found to be (0.691) which indicated that 69.1 % variations in the dependent variable’ effectiveness of CCPM’ are contributed by the independent variables’ feeding buffers’ and ‘resource buffers’ the model.
The presence of a significant impact of the two respective independent variables on the ‘effectiveness of CCPM’ was identified based on their sig. Values. A variable has a significant impact on another variable if its sig. Value is less than 0.05 (Field, 2013).
The results were evident that ‘feeding buffers’ had sig. Value of (0.000), while ‘resource buffers’ had sig. Value of (0.000) and so the two independent variables’ feeding buffers’ and ‘resource buffers’ were found to impact the effectiveness of CCPM significantly. Therefore based on the results to two developed hypotheses of this study H1 and H2 were accepted.
Moreover, the impact’s strength and direction were determined based on the Coefficient (β) values and signs of these two variables. The strength of the impact is strong when the value of β is near (1), while the strength of the impact is moderate when the value of β is near (0.5), and the strength of the impact is weak when the value of β is near (0). On the other hand, the director of the impact is measured based on the negative (-) and positive (+) signs of the independent variables’ β values.
Given this, it was found that the value of β of the two significant variables’ feeding buffers’ and ‘resource buffers’ were found to be (0.633) and (0.536) respectively. This suggested that the strength of the two variables was moderate as their values were near (0.5) and the direction of the impact was positive as the values of β of both the variables were (+) sign.
It means that the two independent variables’ feeding buffers’ and ‘resource buffers’ have a significant, positive, and moderate impact on the effectiveness of CCPM. However, the impact of feeding buffers on the effectiveness of CCPM was slightly stronger than the impact of resource buffers on the effectiveness of CCPM.
Based on the correlation matrix results, it was found that the two independent variables, namely; feeding buffers and resource buffers, have a significant and positive relationship with the effectiveness of CCPM. Meaning the effectiveness of CCPM will move in the same direction as the feeding buffers and resource buffers. This indicates that if the feeding buffers and resource buffers are used in CCPM, then it is likely that the effectiveness of CCPM will improve.
Moreover, based on the results of the multiple regression analysis, it was found that the two independent variables, namely; feeding buffers and resource buffers, have a significant and positive impact on the effectiveness of CCPM. The two hypotheses H1: The feeding buffer can have a significant positive impact on the effectiveness of CCPM, and H2:
The resource buffer can have a significant positive impact on the effectiveness of CCPM, which were developed in this study tested based on the results of regression analysis. Based on the results, the feeding buffers and resource buffers were found to have a significant positive impact on the effectiveness of CCPM. Therefore, the two hypotheses H1 and H2 were accepted. It means that if feeding buffers and resource buffers are used in CCPM, it is possible to improve the effectiveness of CCPM in Canadian home renovation projects.
Furthermore, the frequency distribution analysis results were also conducted, and the findings based on the opinion of the majority of the responding renovation project managers are summarized as follows. It was found that the majority of the responding renovation project managers were males, and therefore, the results may be subjected to gender biases.
The majority of the respondents were between 31 to 50 years of age, representing middle-aged Canadian home renovation project managers. They had 5 to 15 years of work experience as renovation project managers, indicating that they were quite experienced. Therefore the selected research sample was appropriate to collect data as they have sufficient knowledge about the
Canadian home renovation projects provide useful information for this research. Besides, most of the respondents believed that the effectiveness of CCPM could be achieved if feeding and resource buffers are used in CCPM if projects are completed on time, unnecessary wastage of resources is protected, and projects are completed within specific resources.
Additionally, it was found that by adding extra time to each activity on a critical chain in CCPM, it is possible to prevent loss of work due to time delays. Besides, it was found that projects can be completed on time if safety times are added to the critical chain in projects. It was also found that feeling buffers can help in making accurate project schedules.
It was also found that by adding resource buffers to each activity on a critical chain in CCPM, it is possible to prevent work loss due to resource shortage. Moreover, it was found that by adding resource buffers to each activity on a critical chain in CCPM, it is possible to prevent unnecessary wastage of resources. Besides, it was found that resource shortfalls can be avoided if extra (buffers) resources are added to the critical chain in projects. There will be extra resources to employ if the resources are consumed more than was budgeted.
Based on this research it was found that to achieve the effectiveness of CCPM it is necessary to; prevent the unnecessary waste of resources, complete projects on time, and within specific resources to achieve the effectiveness of CCPM. It was evident that by using feeding buffers and resource buffers in CCPM, it is possible to prevent the unnecessary waste of resources, complete projects on time, and within specific resources.
Therefore it is concluded that by using feeding buffers and resource buffers in CCPM, it is possible to improve the effectiveness of CCPM in Canadian home renovation projects. If feeding and resource buffers are used in CCPM, they can help in; project control, accurate schedule, on-time completion, and unnecessary wastage protection.
Based on the research it was found that by using feeding and resource buffers in CCPM it is possible to improve the effectiveness of CCPM in terms of; on-time completion of projects, unnecessary wastage protection, prevention of time delays, accurate scheduling and budgeting.
Therefore the project managers in the Canadian home renovation industry are recommended to employ CCPM and feeding and resource buffers to achieve on-time completion of projects, unnecessary wastage protection, and prevention of time delays, accurate scheduling, and budgeting.
This research’s main limitation was that closed-ended and structured questionnaires were used to collect quantitative data; it is because the questionnaire has some inherent limitations. When data is collected through a closed-ended questionnaire, it is difficult to identify if the respondents were expressing their true opinion or just ticking the answer choices randomly without even reading.
Therefore the results based on the questionnaire may not be representing the actual situation. Moreover, the structured questionnaire has predefined questions that the respondents may interpret and understand differently from the researcher, leading to incorrect results. The closed-ended questionnaire may not have the answer choice which the respondent wanted to select.
So the results based on closed-ended questionnaires may not be representing the true opinion of the respondents. Another limitation of this study was that the research sample had more representation of male than female renovation project managers. So the results may have gender biases present in them.
Limited evidence was found in the existing literature related to feeding buffers and resource buffers on CCPM in Canadian home renovation projects. Therefore, it is recommended that in future research, the same research hypotheses and research model is used to test the impact of feeding buffers and resource buffers on CCPM and validate the finding of this present research.
Besides, in future research, a larger research sample could be used to check if the same results could be obtained using a different research sample. The majority of the responding renovation project managers were males; therefore, a research sample with an equal proportion of male and female renovation project managers is suggested to ensure that the results are free from any gender biases.
This questionnaire is a part of academic research, which aims to find the impact of feeding and resource buffers on the effectiveness of CCPM. You are requested to answer the questions concerning the impact of using feeding and resource buffers in CCPM on the effectiveness of CCPM in Canadian home renovation projects. Thank you!
Section 1: Demographics
Tick one of the options to indicate your selected answer
| 1. Your gender? (1) Male (2) Female |
| 2. What is your age group?
(1) 20 to 30 years (2) 31 to 40 years (3) 41 to 50 years (4) More than 50 years |
| 3. From how many years you have been working as a renovation project manager?
(1) Less than 5 years (2) 5 to 10 years (3) 11 to 15 years (4) More than 15 years |
Section 2: CCPM, feeding buffers and resource buffers
Tick one of the options to indicate your selected answer
| 4. Do you understand what Critical Chain Project Management (CCPM) is?
(1) Yes (2) No |
| 5. Do you understand what are feeding buffers and resource buffers?
(1) Yes (2) No |
Section 3: Effectiveness of CCPM
Tick the boxes to show your level of agreement to the following statements regarding the effectiveness of CCPM. (Where; 1=strongly disagree; 2=disagree; 3=neither agree nor disagree; 4=agree; 5=strongly agree).
| No | Questions | 1 | 2 | 3 | 4 | 5 |
| 6. | The effectiveness of CCPM can be achieved if feeding and resource buffers are used in CCPM. | |||||
| 7. | The effectiveness of CCPM can be achieved if projects are completed on time. | |||||
| 8. | The effectiveness of CCPM can be achieved if unnecessary wastage is protected. | |||||
| 9. | The effectiveness of CCPM can be achieved if projects are completed within specific resources. |
Section 4: Feeding buffers
Tick the boxes to show your level of agreement to the following statements regarding feeding buffers. (Where; 1=strongly disagree; 2=disagree; 3= neither agree nor disagree; 4=agree; 5=strongly agree).
| No | Questions | 1 | 2 | 3 | 4 | 5 |
| 10. | If extra time is added to each activity on a critical chain in CCPM, it is possible to prevent idle time (loss of work) due to time delays. | |||||
| 11. | Projects can be completed on time if safety times are added to the critical chain in projects. | |||||
| 12. | Feeding buffers can help in making accurate project schedules. |
Section 5: Resource buffers
Tick the boxes to show your level of agreement to the following statements regarding resource buffers. (Where; 1=strongly disagree; 2=disagree; 3= neither agree nor disagree; 4=agree; 5=strongly agree).
| No | Question | 1 | 2 | 3 | 4 | 5 |
| 13. | If resource buffers are added to each activity on a critical chain in CCPM, it is possible to prevent idle time (loss of work) due to resource shortage. | |||||
| 14. | Unnecessary wastage can be prevented if extra (buffers) resources are added to the projects’ critical chain. | |||||
| 15. | Resources shortfalls can be avoided if extra (buffers) resources are added to the projects’ critical chain. |
Scale: ALL VARIABLES
| Case Processing Summary | |||
| N | % | ||
| Cases | Valid | 70 | 100.0 |
| Excluded | 0 | .0 | |
| Total | 70 | 100.0 | |
| a. Listwise deletion based on all variables in the procedure. | |||
| Reliability Statistics | |||
| Cronbach’s Alpha | N of Items | ||
| .916 | 10 | ||
| Descriptive Statistics | ||||
| N | Minimum | Maximum | Mean | |
| What is your age group? | 70 | 1 | 4 | 2.81 |
| From how many years you have been working as a renovation project manager? | 70 | 1 | 4 | 2.81 |
| Do you understand what Critical Chain Project Management (CCPM) is? | 70 | 1 | 1 | 1.00 |
| Do you understand what are feeding buffers and resource buffers? | 70 | 1 | 1 | 1.00 |
| The effectiveness of CCPM can be achieved if feeding and resource buffers are used in CCPM | 70 | 1 | 5 | 4.49 |
| The effectiveness of CCPM can be achieved if projects are completed on time | 70 | 2 | 5 | 4.46 |
| The effectiveness of CCPM can be achieved if unnecessary wastage is protected | 70 | 2 | 5 | 4.53 |
| The effectiveness of CCPM can be achieved if projects are completed within specific resources | 70 | 2 | 5 | 4.53 |
| If extra time is added to each activity on a critical chain in CCPM, it is possible to prevent idle time (loss of work) due to time delays | 70 | 2 | 5 | 4.49 |
| Projects can be completed on time if safety times are added to the critical chain in projects | 70 | 2 | 5 | 4.01 |
| Feeding buffers can help in making accurate project schedules | 70 | 2 | 5 | 4.49 |
| If resource buffers are added to each activity on a critical chain in CCPM, it is possible to prevent idle time (loss of work) due to resource shortage | 70 | 2 | 5 | 4.13 |
| Unnecessary wastage can be prevented if extra (buffers) resources are added to the critical chain in projects | 70 | 2 | 5 | 4.63 |
| Resources shortfalls can be avoided if extra (buffers) resources are added to the critical chain in projects | 70 | 2 | 5 | 4.53 |
| Valid N (listwise) | 70 | |||
| Your gender? | |||||
| Frequency | Per cent | Valid Percent | Cumulative Percent | ||
| Valid | Male | 46 | 65.7 | 65.7 | 65.7 |
| Female | 24 | 34.3 | 34.3 | 100.0 | |
| Total | 70 | 100.0 | 100.0 | ||
| What is your age group? | |||||
| Frequency | Per cent | Valid Percent | Cumulative Percent | ||
| Valid | 20 to 30 years | 3 | 4.3 | 4.3 | 4.3 |
| 31 to 40 years | 21 | 30.0 | 30.0 | 34.3 | |
| 41 to 50 years | 32 | 45.7 | 45.7 | 80.0 | |
| More than 50 years | 14 | 20.0 | 20.0 | 100.0 | |
| Total | 70 | 100.0 | 100.0 | ||
| From how many years you have been working as a renovation project manager? | |||||
| Frequency | Per cent | Valid Percent | Cumulative Percent | ||
| Valid | Less than 5 years | 2 | 2.9 | 2.9 | 2.9 |
| 5 to 10 years | 24 | 34.3 | 34.3 | 37.1 | |
| 11 to 15 years | 29 | 41.4 | 41.4 | 78.6 | |
| More than 15 years | 15 | 21.4 | 21.4 | 100.0 | |
| Total | 70 | 100.0 | 100.0 | ||
| Do you understand what Critical Chain Project Management (CCPM) is? | |||||
| Frequency | Per cent | Valid Percent | Cumulative Percent | ||
| Valid | Yes | 70 | 100.0 | 100.0 | 100.0 |
| Do you understand what are feeding buffers and resource buffers? | |||||
| Frequency | Per cent | Valid Percent | Cumulative Percent | ||
| Valid | Yes | 70 | 100.0 | 100.0 | 100.0 |
| The effectiveness of CCPM can be achieved if feeding and resource buffers are used in CCPM | |||||
| Frequency | Per cent | Valid Percent | Cumulative Percent | ||
| Valid | Strongly disagree | 2 | 2.9 | 2.9 | 2.9 |
| Disagree | 1 | 1.4 | 1.4 | 4.3 | |
| Neither agree nor disagree | 2 | 2.9 | 2.9 | 7.1 | |
| Agree | 21 | 30.0 | 30.0 | 37.1 | |
| Strongly agree | 44 | 62.9 | 62.9 | 100.0 | |
| Total | 70 | 100.0 | 100.0 | ||
| The effectiveness of CCPM can be achieved if projects are completed on time. | |||||
| Frequency | Per cent | Valid Percent | Cumulative Percent | ||
| Valid | Disagree | 3 | 4.3 | 4.3 | 4.3 |
| Neither agree nor disagree | 6 | 8.6 | 8.6 | 12.9 | |
| Agree | 17 | 24.3 | 24.3 | 37.1 | |
| Strongly agree | 44 | 62.9 | 62.9 | 100.0 | |
| Total | 70 | 100.0 | 100.0 | ||
|
The effectiveness of CCPM can be achieved if unnecessary wastage of resources is protected. |
|||||
| Frequency | Per cent | Valid Percent | Cumulative Percent | ||
| Valid | Disagree | 3 | 4.3 | 4.3 | 4.3 |
| Neither agree nor disagree | 3 | 4.3 | 4.3 | 8.6 | |
| Agree | 18 | 25.7 | 25.7 | 34.3 | |
| Strongly agree | 46 | 65.7 | 65.7 | 100.0 | |
| Total | 70 | 100.0 | 100.0 | ||
| The effectiveness of CCPM can be achieved if projects are completed within specific resources. | |||||
| Frequency | Per cent | Valid Percent | Cumulative Percent | ||
| Valid | Disagree | 4 | 5.7 | 5.7 | 5.7 |
| Neither agree nor disagree | 1 | 1.4 | 1.4 | 7.1 | |
| Agree | 19 | 27.1 | 27.1 | 34.3 | |
| Strongly agree | 46 | 65.7 | 65.7 | 100.0 | |
| Total | 70 | 100.0 | 100.0 | ||
| If extra time is added to each activity on a critical chain in CCPM, it is possible to prevent idle time (loss of work) due to time delays. | |||||
| Frequency | Per cent | Valid Percent | Cumulative Percent | ||
| Valid | Disagree | 1 | 1.4 | 1.4 | 1.4 |
| Neither agree nor disagree | 7 | 10.0 | 10.0 | 11.4 | |
| Agree | 19 | 27.1 | 27.1 | 38.6 | |
| Strongly agree | 43 | 61.4 | 61.4 | 100.0 | |
| Total | 70 | 100.0 | 100.0 | ||
| Projects can be completed on time if safety times are added to the critical chain in projects. | |||||
| Frequency | Per cent | Valid Percent | Cumulative Percent | ||
| Valid | Disagree | 7 | 10.0 | 10.0 | 10.0 |
| Neither agree nor disagree | 16 | 22.9 | 22.9 | 32.9 | |
| Agree | 16 | 22.9 | 22.9 | 55.7 | |
| Strongly agree | 31 | 44.3 | 44.3 | 100.0 | |
| Total | 70 | 100.0 | 100.0 | ||
| Feeding buffers can help in making accurate project schedules. | |||||
| Frequency | Per cent | Valid Percent | Cumulative Percent | ||
| Valid | Disagree | 3 | 4.3 | 4.3 | 4.3 |
| Neither agree nor disagree | 4 | 5.7 | 5.7 | 10.0 | |
| Agree | 19 | 27.1 | 27.1 | 37.1 | |
| Strongly agree | 44 | 62.9 | 62.9 | 100.0 | |
| Total | 70 | 100.0 | 100.0 | ||
| If resource buffers are added to each activity on a critical chain in CCPM, it is possible to prevent idle time (loss of work) due to resource shortage. | |||||
| Frequency | Per cent | Valid Percent | Cumulative Percent | ||
| Valid | Disagree | 2 | 2.9 | 2.9 | 2.9 |
| Neither agree nor disagree | 19 | 27.1 | 27.1 | 30.0 | |
| Agree | 17 | 24.3 | 24.3 | 54.3 | |
| Strongly agree | 32 | 45.7 | 45.7 | 100.0 | |
| Total | 70 | 100.0 | 100.0 | ||
| Unnecessary wastage of resources can be prevented if extra (buffers) resources are added to the projects’ critical chain. | |||||
| Frequency | Per cent | Valid Percent | Cumulative Percent | ||
| Valid | Disagree | 1 | 1.4 | 1.4 | 1.4 |
| Neither agree nor disagree | 3 | 4.3 | 4.3 | 5.7 | |
| Agree | 17 | 24.3 | 24.3 | 30.0 | |
| Strongly agree | 49 | 70.0 | 70.0 | 100.0 | |
| Total | 70 | 100.0 | 100.0 | ||
| Resources shortfalls can be avoided if extra (buffers) resources are added to the projects’ critical chain. | |||||
| Frequency | Per cent | Valid Percent | Cumulative Percent | ||
| Valid | Disagree | 3 | 4.3 | 4.3 | 4.3 |
| Neither agree nor disagree | 1 | 1.4 | 1.4 | 5.7 | |
| Agree | 22 | 31.4 | 31.4 | 37.1 | |
| Strongly agree | 44 | 62.9 | 62.9 | 100.0 | |
| Total | 70 | 100.0 | 100.0 | ||
| Correlations | ||||
| Effectiveness_of_CCPM | Feeding_buffers | Resource_buffers | ||
| Effectiveness_of_CCPM | Pearson Correlation | 1 | .787** | .736** |
| Sig. (2-tailed) | .000 | .000 | ||
| N | 70 | 70 | 70 | |
| Feeding_buffers | Pearson Correlation | .787** | 1 | .665** |
| Sig. (2-tailed) | .000 | .000 | ||
| N | 70 | 70 | 70 | |
| Resource_buffers | Pearson Correlation | .736** | .665** | 1 |
| Sig. (2-tailed) | .000 | .000 | ||
| N | 70 | 70 | 70 | |
| **. Correlation is significant at the 0.01 level (2-tailed). | ||||
| Variables Entered/Removed | |||
| Model | Variables Entered | Variables Removed | Method |
| 1 | Resource_buffers, Feeding_buffersa | . | Enter |
| a. All requested variables entered. | |||
| Model Summary | ||||
| Model | R | R Square | Adjusted R Square | Std. The error of the Estimate |
| 1 | .837a | .700 | .691 | .434 |
| a. Predictors: (Constant), Resource_buffers, Feeding_buffers | ||||
| ANOVA | ||||||
| Model | Sum of Squares | df | Mean Square | F | Sig. | |
| 1 | Regression | 29.496 | 2 | 14.748 | 78.239 | .000a |
| Residual | 12.629 | 67 | .188 | |||
| Total | 42.125 | 69 | ||||
| a. Predictors: (Constant), Resource_buffers, Feeding_buffers | ||||||
| b. Dependent Variable: Effectiveness_of_CCPM | ||||||
| Coefficients | ||||||
| Model | Unstandardized Coefficients | Standardized Coefficients | t | Sig. | ||
| B | Std. Error | Beta | ||||
| 1 | (Constant) | -.612 | .429 | -1.427 | .158 | |
| Feeding_buffers | .633 | .106 | .533 | 5.949 | .000 | |
| Resource_buffers | .536 | .126 | .382 | 4.259 | .000 | |
| a. Dependent Variable: Effectiveness_of_CCPM | ||||||
If you are the original writer of this Dissertation and no longer wish to have it published on the www.ResearchProspect.com then please:
The time to write an undergraduate full dissertation varies, but it typically takes several months, including research, drafting, and revisions.

All work is written by human writers. 100% AI free, guaranteed.

100% money back guarantee if you find plagiarism in our work.
COMPANY DETAILS


