Disclaimer: This is not a sample of our professional work. The paper has been produced by a student. You can view samples of our work here. Opinions, suggestions, recommendations and results in this piece are those of the author and should not be taken as our company views.
Type of Academic Paper – Dissertation Chapter
Academic Subject – Marketing
Word Count – 3017 words
The current chapter presents developing the research methods needed to complete the experimentation portion of the current study. The chapter will discuss in detail the various stages of developing the methodology of the current study. This includes a detailed discussion of the philosophical background of the research method chosen. In addition to this, the chapter describes the data collection strategy, including the selection of research instrumentation and sampling. The chapter closes with a discussion on the analysis tools used to analyse the data collected.
Creswall (2013) stated that research approaches are plans and procedures that range from steps, including making broad assumptions to detailed methods of data collection, analysis, and interpretation. The several decisions involved in the process are used to decide which approach should be used in a specific study that is informed using philosophical assumptions brought to the study (Creswall 2013). Included in this are procedures of inquiry or research designs and specific research methods used for data collection, its analysis, and finally, its interpretation. However, Guetterman (2015); Lewis (2015); and Creswall (2013) argue that the selection of the specific research approach is based on the nature of the research problem, or the issue that is being addressed by any study, personal experiences of the researchers’, and even the audience for which the study is being developed for.
There are many ways to customise research approaches to develop an approach most suited for a particular study. However, the main three categories with which research approaches are organised include; qualitative, quantitative, and mixed research methods. Creswall (2013) comments that all three approaches are not considered so discrete or distinct from one another. Creswall (2013) states, “qualitative and quantitative approaches should not be viewed as rigid, distinct categories, polar opposite, or dichotomies” (p.32). Newmand and Benz (1998) pointed out that quantitative and qualitative approaches instead represent different ends on a continuum since a study “tends” to be more quantitative than qualitative or vice versa. Lastly, mixed methods research resides in the middle of the continuum as it can incorporate elements and characteristics of both quantitative and qualitative approaches. Lewis (2015) points out that the main distinction that is often cited between quantitative and qualitative research is that it is framed in terms of using numbers rather than words; or using closed-ended questions for quantitative hypotheses over open-ended questions for qualitative interview questions. Guetterman (2015) points out that a clearer way of viewing gradations of differences between the approaches is to examine the basic philosophical assumptions brought to the study, the kinds of research strategies used, and the particular methods implemented in conducting the strategies.
An important component of defining the research approach involves philosophical assumptions that contribute to the broad research approach of planning or proposing to conduct research. It involves the intersection of philosophy, research designs and specific methods as illustrated in Fig. 1 below.
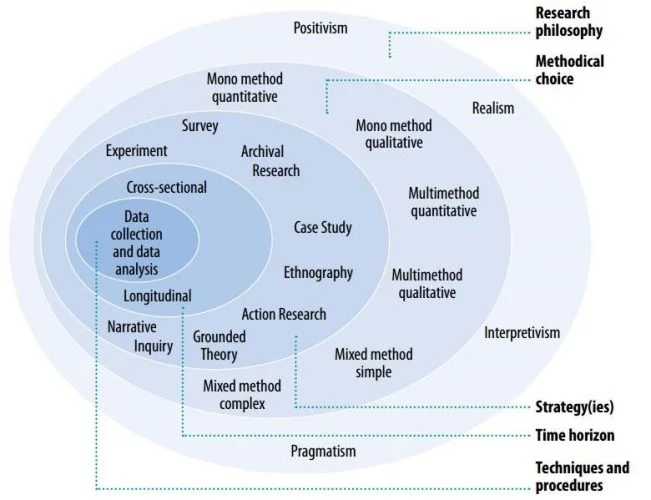
Figure 3.2-1- Research Onion (Source; Saunders and Tosey 2013)
Slife and Williams (1995) have argued that philosophical ideas have remained hidden within the research. However, they still play an influential role in the research practice, and it is for this reason that it is most identified. Various philosophical assumptions are used to construct or develop a study. Saunders et al. (2009) define research philosophy as a belief about how data about a phenomenon should be gathered, analysed and used. Saunders et al. (2009) identify common research philosophies such as positivism, realism, interpretivism, subjectivism, and pragmatism. Dumke (2002) believes that two views, positivism and phenomenology, mainly characterise research philosophy.
Positivism reflects acceptance in adopting the philosophical stance of natural scientists (Saunders, 2003). According to Remenyi et al. (1998), there is a greater preference in working with an “observable social reality” and that the outcome of such research can be “law-like” generalisations that are the same as those which are produced by physical and natural scientists. Gill and Johnson (1997) add that it will also emphasise a high structure methodology to allow for replication for other studies. Dumke (2002) agrees and explains
that a positivist philosophical assumption produces highly structured methodologies and allows for generalisation and quantification of objectives that can be evaluated by statistical methods. For this philosophical approach, the researcher is considered an objective observer who should not be impacted by or impact the subject of research.
On the other hand, more phenomenological approaches agree that the social world of business and management is too complex to develop theories and laws similar to natural sciences. Saunders et al. (2000) argue that this is the reason why reducing observations in the real world to simple laws and generalisations produces a sense of reality which is a bit superficial and doesn’t present the complexity of it.
The current study chooses positivistic assumptions due to the literature review’s discussion of the importance of Big Data in industrial domains and the need for measuring its success in the operations of the business. The current study aims to examine the impact that Big Data has on automobile companies’ operations. To identify a positive relationship between Big Data usage and beneficial business outcomes, the theory needs to be used to generate hypotheses that can later be tested of the relationship which would allow for explanations of laws that can later be assessed (Bryman and Bell, 2015).
Interpretive research approaches are derived from the research philosophy that is adopted. According to Dumke (2002), the two main research approaches are deductive and inductive. The inductive approach is commonly referred to when theory is derived from observations. Thus, the research begins with specific observations and measures. It is then from detecting some pattern that a hypothesis is developed. Dumke (2002) argues that researchers who use an inductive approach usually work with qualitative data and apply various methods to gather specific information that places different views. From the philosophical assumptions discussed in the previous section, it is reasonable to use the deductive approach for the current study. It is also considered the most commonly used theory to establish a relationship between theory and research. The figure below illustrates the steps used for the process of deduction.
Based on what is known about a specific domain, the theoretical considerations encompassing it a hypothesis or hypotheses are deduced that will later be subjected to empirical enquiry (Daum, 2013). Through these hypotheses, concepts of the subject of interest will be translated into entities that are rational for a study. Researchers are then able to deduce their hypotheses and convert them into operational terms.
Orders completed by our expert writers are

Saunders (2003) notes that almost all research will involve some numerical data or even contain data quantified to help a researcher answer their research questions and meet the study’s objectives. However, quantitative data refers to all data that can be a product of all research strategies (Bryman and Bell, 2015; Guetterman, 2015; Lewis, 2015; Saunders, 2003). Based on the philosophical assumptions and interpretive research approach, a quantitative research method is the best suited for the current study. Haq (2014) explains that quantitative research is about collecting numerical data and then analysing it through statistical methods to explain a specific phenomenon. Mujis (2010) defends the use of quantitative research because, unlike qualitative research, which argues that there is no pre-existing reality, quantitative assumes that there is only a single reality about social conditions that researchers cannot influence in any way. Also, qualitative research is commonly used when there is little to no knowledge of a phenomenon, whereas quantitative research is used to find the cause and effect relationship between variables to either verify or nullify some theory or hypothesis (Creswall 2002; Feilzer 2010; Teddlie and Tashakkori 2012).
There are many strategies available to implement in a study, as evidenced from Fig. 1. There are many mono-quantitative methods, such as telephone interviews, web-based surveys, postal surveys, and structured questionnaires (Haq 2014). Each instrument has its own pros and cons in terms of quality, time, and data cost. Brymand (2006); Driscoll et al. (2007); Edwards et al. (2002); and Newby et al. (2003) note that most researchers use structured questionnaires for data collection they are unable to control or influence respondents, which leads to low response rates but more accurate data obtained. Saunders and Tosey (2015) have argued that quantitative data is simpler to obtain and more concise to present. Therefore, the current study uses a survey-based questionnaire (See Appendix A).
Surveys are considered the most traditional forms of research and are used in non-experimental descriptive designs that describe some reality. Survey-based questionnaires are often restricted to a representative sample of a potential group of the study’s interest. In this case, it is the executives currently working for automobile companies in the UK. The survey instrument is then chosen for its effectiveness at being practical and inexpensive (Kelley et al., 2003). Due to the philosophical assumptions, interpretive approach, and methodological approach, the survey design for the current study is considered the best instrument in line with these premises, besides being cost-effective.
This section describes how research is designed to use the techniques used for data collection, sampling strategy, and data analysis for a quantitative method. Before going into the strategies of data collection and analysis, a set of hypotheses were developed.
The current study uses a quantitative research approach, making it essential to develop a set of hypotheses that will be used as a test standard for the mono-method quantitative design. The following are a set of hypotheses that have been developed from the examination of the literature review.
H1- The greater the company’s budget for Big Data initiatives (More than 1 million GBP), the greater its ability to monetise and generate new revenues.
H2- The greater the company’s budget for Big Data initiatives (More than 1 million GBP) the more decrease in expenses in found.
H3- The greatest impact of Big Data on a company is changing the way business is done.
H4- Big Data integrating with a company has resulted in competitive significance.
H5- The analytical abilities of a company allows for achieved measurable results.
H6- Investing in Big Data will lead to highly successful business results.
H7- A business’s operations function is fuelling Big Data initiatives and effecting change in operations.
H8- The implementation of Big Data in the company has positive impacts on business.
This section includes the sampling method used to collect the number of respondents needed to provide information, then analysed after collection.
Collis (2009) explains that there are many kinds of sampling methods that can be used for creating a specific target sample from a population. This current study uses simple random sampling to acquire respondents with which the survey will be conducted. Simple random sampling is considered the most basic form of probability sampling. Under the method, elements are taken from the population at random, with all elements having an equal chance of being selected. According to () as of 2014, there are about thirty-five active British car manufacturers in the UK, each having an employee population of 150 or more. This is why the total population of employees in car manufacturers is estimated to be 5,250 employees. The sample, therefore, developed used the following equation;
2 × (1 − )
2
+( 2× (1− )) 2
Where; N is the population size, e is the margin of error (as a decimal), z is confidence level (as a z-score), and p is percentage value (as a decimal). Thus, the sample size is with a normal distribution of 50%. With the above equation, a population of 5,250; with a 95% confidence level and 5% margin of error, the total sample size needed for the current equals 300. Therefore, N=300, which is the sample size of the current study.
The survey develops (see Appendix A) has a total of three sections, A, B, and C, with a total of 39 questions. Each section has its own set of questions to accomplish. The survey is a mix of closed-end questions that look to comprehend the respondents’ demographic makeup, the Big Data initiatives of the company, and the impact that Big Data was having on their company. The survey is designed to take no longer than twenty minutes. The survey was constructed on Survey Monkey.com, and an online survey provided website. The survey was left on the website for a duration of 40 days to ensure that the maximum number of respondents were able to answer the survey. The only way that the survey was allowed for a respondent is if they passed a security question as if they were working for an automobile company in the UK when taking the survey. Gupta et al. (2004) believe that web surveys are visual stimuli, and the respondent has complete control about whether or how each question is read and understood. That is why Dillman (2000) argued that web questionnaires are expected to resemble those taken through the mail/postal services closely.
The collected data is then analysed through the Statistical Package for Social Science (SPSS) version 24 for descriptive analysis. The demographic section of the survey will be analysed using descriptive statistics. Further analysis of the data includes regression analysis. Simple regression analysis includes only one independent variable and one dependent variable. Farrar and Glauber (1967) assert that the purpose of regression analysis is to estimate the parameters of dependency, and it should not be used to determine the interdependency of a relationship.
The chapter provides a descriptive and in-depth discussion of the methods involved in the current study’s research. The current study is looking towards a quantitative approach that considers positivism as its philosophical undertaking, using deductive reasoning for its interpretive approach, is a mono-quantitative method that involves the use of a survey instrument for data collection. The methodology chapter also provided the data analysis technique, which is descriptive statistics through frequency analysis and regression analysis.
Question 8- Of these staff, are mostly working in or for your consumer-facing (B2C) businesses, your commercial or wholesale (B2B) businesses, or both?
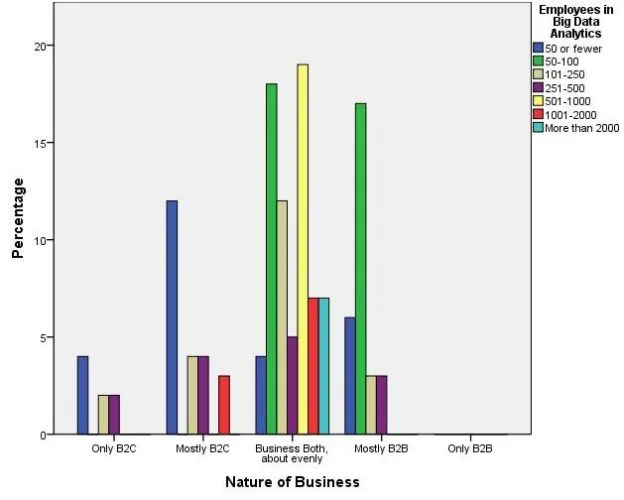
Based on the illustration, nineteen (19) respondents indicated that 501-1000 employees are dedicated to analytics for both B2B and B2C. The category of using Big Data analytics for both B2B and B2C comprises the most agreement of respondents with 72 of 132 indicated.
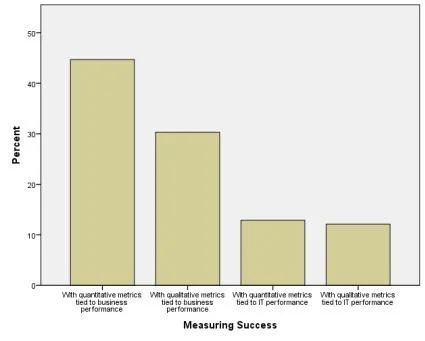
The figure above represents the respondents’ answers to their automobile company’s plan for measuring Big Data’s success. Of the 132 participants, 44.70 per cent responded that the company is planning on using quantitative metrics associated with business performance to analyse if Big Data is actually successful. Another, 30.30 per cent indicated that their company was planning on using qualitative metrics tied to business performance. Using business performance to analyse the success of Big Data is coherent to the results of the literature review that indicated previous studies of doing such. As an automobile company, they need to know the results of using Big Data analytics, and that is only by using business performance indicators regardless of being qualitative or quantitative.
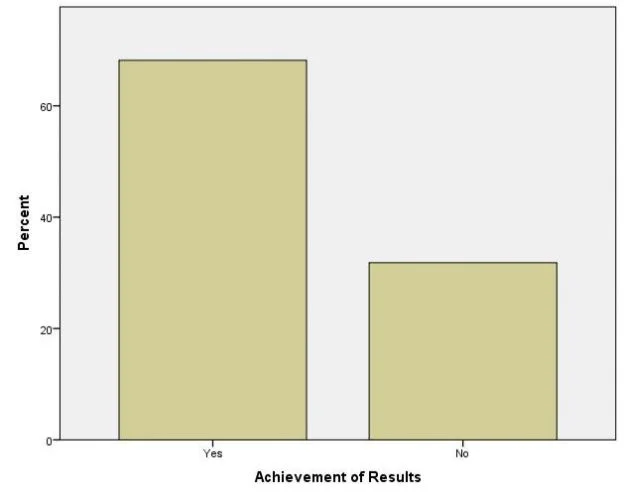
Fig. 4.3-6 portrays the response of participants in regards to actually achieving measurable results from Big Data. According to 68.18 per cent of respondents, the company that they worked for did indeed show measurable results from their investments in Big Data. However, 31.82 per cent indicated that there was indeed no measurable result in investing in Big Data.
Bryman, A., Bell, E., 2015. Business Research Methods. Oxford University Press.
Daum, P., 2013. International Synergy Management: A Strategic Approach for Raising Efficiencies in the Cross-border Interaction Process. Anchor Academic Publishing (aap_verlag).
Dümke, R., 2002. Corporate Reputation and its Importance for Business Success: A European
Perspective and its Implication for Public Relations Consultancies. diplom.de.
Guetterman, T.C., 2015. Descriptions of Sampling Practices Within Five Approaches to Qualitative Research in Education and the Health Sciences. Forum Qualitative Sozialforschung /
Forum: Qualitative Social Research 16.
Haq, M., 2014. A Comparative Analysis of Qualitative and Quantitative Research Methods and a Justification for Adopting Mixed Methods in Social Research (PDF Download Available).
ResearchGate 1–22. doi:http://dx.doi.org/10.13140/RG.2.1.1945.8640
Kelley, K., Clark, B., Brown, V., Sitzia, J., 2003. Good practice in the conduct and reporting of survey research. Int J Qual Health Care 15, 261–266. doi:10.1093/intqhc/mzg031
Lewis, S., 2015. Qualitative Inquiry and Research Design: Choosing Among Five Approaches.
Health Promotion Practice 16, 473–475. doi:10.1177/1524839915580941
Saunders, M., 2003. Research Methods for Business Students. Pearson Education India.
Saunders, M.N.K., Tosey, P., 2015. Handbook of Research Methods on Human Resource
Development. Edward Elgar Publishing.
If you are the original writer of this Dissertation Chapter and no longer wish to have it published on the www.ResearchProspect.com then please:
To write the methodology chapter of a dissertation:

All work is written by human writers. 100% AI free, guaranteed.

100% money back guarantee if you find plagiarism in our work.
COMPANY DETAILS


