A worked Undergraduate biology lab report example, free to read in full below — get one written for your own brief, or browse more report samples.
Type
Lab Report
Discipline
Biology
Level
Undergraduate
Word count
888
Quality
2:1 / 68%
The aim of this investigation was to determine how varying light intensity affects the rate of photosynthesis in the aquatic plant Elodea canadensis, measured by the volume of oxygen produced. It was hypothesised that the rate would increase with light intensity before plateauing once another factor became limiting.
Photosynthesis is the process by which green plants convert light energy into chemical energy, synthesising glucose from carbon dioxide and water while releasing oxygen as a by-product (Taiz and Zeiger, 2015). The overall reaction is commonly summarised in a single balanced equation.
The rate of photosynthesis is governed by several environmental factors, including light intensity, carbon dioxide concentration and temperature. Blackman (1905) proposed the principle of limiting factors, which states that the rate of a process is constrained by the factor in shortest supply.
Light provides the energy that drives the light-dependent reactions within the thylakoid membranes of the chloroplast. At low intensities, light is the limiting factor, so increasing it raises the rate proportionally (Hall and Rao, 1999).
However, at higher intensities the rate is expected to level off. Beyond this point, another factor such as carbon dioxide availability or temperature restricts the rate, so additional light produces no further increase (Whitmarsh and Govindjee, 1999).
Elodea is a convenient organism for this study because it is submerged and releases oxygen bubbles that can be readily counted or collected. This investigation matters because understanding limiting factors underpins glasshouse crop management and models of primary productivity.
The apparatus and materials used are listed below.
The Elodea sprig was cut at an angle and placed cut-end uppermost inside an inverted funnel within a boiling tube filled with sodium hydrogen carbonate solution. This solution ensured a constant supply of carbon dioxide throughout the experiment.
A water bath was used to maintain the solution at a constant 25 °C, and the temperature was checked with a thermometer. The lamp was positioned at a measured distance from the boiling tube using the metre ruler.
The plant was allowed to acclimatise for five minutes at each distance. The oxygen collected over a fixed three-minute period was then measured using the gas syringe. Light intensity was varied by altering the lamp distance, and readings were expressed in arbitrary units.
Three repeat readings were taken at each light intensity, and the mean volume of oxygen was calculated. All other variables were kept constant to ensure a fair test.
Report Writing Service
Need a biology lab report written to this standard?
Our subject specialists write fully referenced, plagiarism-free reports to your exact brief and deadline, with a free plagiarism report.
The mean volume of oxygen produced increased steadily as light intensity rose from 10 to 40 arbitrary units. Beyond 50 units, the rate levelled off, with little further increase in oxygen production. The mean results are summarised below.
| Light Intensity (arbitrary units) | Mean Volume of Oxygen Produced in 3 Minutes (cm³) |
| 10 | 0.8 |
| 20 | 1.6 |
| 30 | 2.5 |
| 40 | 3.3 |
| 50 | 3.9 |
| 60 | 4.1 |
| 70 | 4.2 |
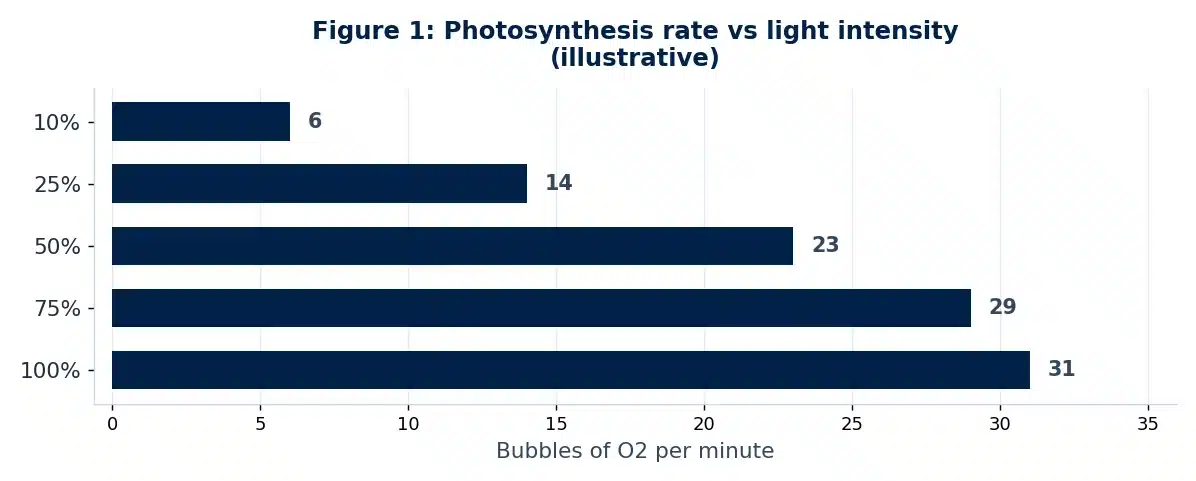
The relationship between light intensity and oxygen production is displayed graphically in Figure 1. The curve rises steeply at first and then flattens, forming a characteristic plateau at the higher intensities tested.
The results support the hypothesis. At low light intensities, oxygen production increased almost proportionally with intensity, indicating that light was the limiting factor for the rate of photosynthesis, as predicted by Blackman (1905).
As intensity rose above 50 arbitrary units, the rate plateaued. This suggests that light was no longer limiting and that another factor, most likely carbon dioxide concentration or temperature, had become the constraint on the reaction (Taiz and Zeiger, 2015).
These findings agree with established theory. The initial linear region and subsequent plateau reflect the classic response curve reported in the literature (Hall and Rao, 1999), confirming that the light-dependent reactions can only proceed as fast as substrates allow.
Several sources of error should be noted. Counting or measuring bubbles assumes each contained pure oxygen and a uniform volume, which is unlikely. Dissolved oxygen may also have escaped or remained in solution rather than being collected.
Light intensity was assumed to follow the inverse square law based on distance, yet background laboratory light was not fully excluded. This may have raised the effective intensity, particularly at greater lamp distances, reducing the accuracy of the lowest readings.
The investigation could be improved by using a data logger with an oxygen sensor for more precise measurement and by conducting the experiment in a darkened room. A wider range of intensities would also better define the plateau.
In conclusion, the rate of photosynthesis in Elodea, measured by oxygen production, increased as light intensity rose and then plateaued at higher intensities. This confirms that light is limiting only at lower levels, after which another factor constrains the rate, supporting the original hypothesis.
Hall, D.O. and Rao, K.K. (1999) Photosynthesis. 6th edn. Cambridge: Cambridge University Press.
Taiz, L. and Zeiger, E. (2015) Plant Physiology and Development. 6th edn. Sunderland, MA: Sinauer Associates.
Whitmarsh, J. and Govindjee (1999) ‘The photosynthetic process’, in Singhal, G.S., Renger, G., Sopory, S.K., Irrgang, K.-D. and Govindjee (eds.) Concepts in Photobiology: Photosynthesis and Photomorphogenesis. New Delhi: Narosa Publishers, pp. 11-51.

All work is written by human writers. 100% AI free, guaranteed.

100% money back guarantee if you find plagiarism in our work.
COMPANY DETAILS