A worked Undergraduate physics lab report example, free to read in full below — get one written for your own brief, or browse more report samples.
Type
Lab Report
Discipline
Physics
Level
Undergraduate
Word count
937
Quality
1st / 71%
The aim of this investigation was to determine the acceleration due to gravity, g, by measuring the period of oscillation of a simple pendulum across a range of lengths. It was hypothesised that the square of the period would vary linearly with pendulum length.
A simple pendulum consists of a point mass, or bob, suspended from a fixed pivot by a light, inextensible string. When displaced through a small angle and released, it undergoes periodic motion under the restoring influence of gravity.
This motion provides a classic method for estimating g in the teaching laboratory.
For small angular displacements, the restoring force is approximately proportional to the displacement, and the motion approximates simple harmonic motion (Serway and Jewett, 2018). Under this approximation, the period T of a pendulum of length L is described by the standard relationship shown below.
The governing equation is T = 2π√(L/g), where g is the acceleration due to gravity. Squaring both sides yields T² = (4π²/g)L, a linear relationship between T² and L. A graph of T² against L should therefore produce a straight line through the origin.
The gradient of this line equals 4π²/g, so g may be extracted from the measured gradient. This linearisation approach is widely favoured because it distributes measurement uncertainty across many data points and reduces the influence of any single reading (Hughes and Hase, 2010).
The small-angle approximation, sin θ ≈ θ, holds well for displacements below roughly 10°. Beyond this angle, the period lengthens measurably and the simple model breaks down. Maintaining small amplitudes was therefore essential to the validity of the investigation (Young and Freedman, 2016).
The following apparatus was used during the investigation:
The string was clamped firmly between two wooden blocks at the pivot to provide a well-defined point of suspension. The bob was attached to the free end, and the length was measured from the pivot to the centre of the bob using the metre rule.
The pendulum was displaced through an angle of less than 10° and released. The time for twenty complete oscillations was recorded with the stopwatch, and this measurement was repeated three times at each length to reduce random error.
The procedure was repeated for seven lengths, ranging from 0.200 m to 0.800 m in steps of 0.100 m. The mean time was calculated at each length and divided by twenty to obtain the period T. The value of T² was then computed for analysis.
Report Writing Service
Need a physics lab report written to this standard?
Our subject specialists write fully referenced, plagiarism-free reports to your exact brief and deadline, with a free plagiarism report.
The measured periods and their squares are presented in the table below. The mean period was derived from three repeated timings of twenty oscillations at each length.
| Length L (m) | Mean time for 20 oscillations (s) | Period T (s) | T² (s²) |
| 0.200 | 17.94 | 0.897 | 0.805 |
| 0.300 | 21.98 | 1.099 | 1.208 |
| 0.400 | 25.38 | 1.269 | 1.610 |
| 0.500 | 28.36 | 1.418 | 2.011 |
| 0.600 | 31.08 | 1.554 | 2.415 |
| 0.700 | 33.56 | 1.678 | 2.816 |
| 0.800 | 35.88 | 1.794 | 3.218 |
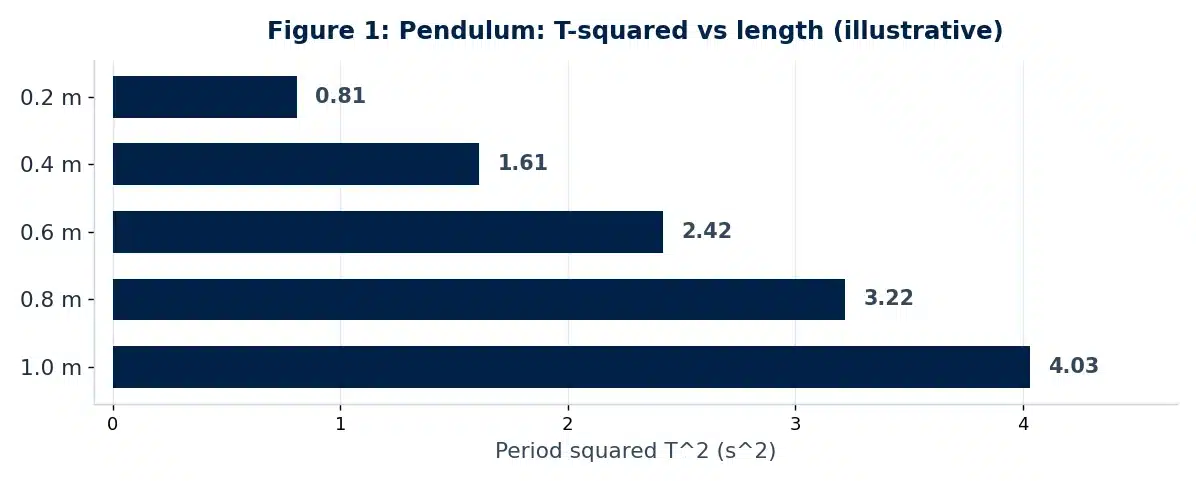
When T² was plotted against L, as shown in Figure 1, the data points fell closely along a straight line passing near the origin. The strong linear trend confirmed the predicted proportionality between the period squared and the length.
The gradient of the line of best fit was found to be 4.03 s² m⁻¹. Using g = 4π²/gradient, this gradient yielded a value for the acceleration due to gravity of 9.79 m s⁻². The intercept was negligibly small, consistent with the theoretical prediction.
The results support the hypothesis that T² varies linearly with L. The near-zero intercept and the close fit of the data to a straight line indicate that the simple harmonic model described the pendulum’s behaviour well across the range of lengths tested.
The experimental value of 9.79 m s⁻² compares very favourably with the accepted value of 9.81 m s⁻² (Young and Freedman, 2016). The discrepancy of roughly 0.2% suggests that systematic errors were small and that the method was both accurate and reliable.
Several sources of error were nonetheless present. Reaction time in starting and stopping the stopwatch introduced random timing error, although timing twenty oscillations rather than one reduced its proportional effect considerably (Hughes and Hase, 2010).
Systematic error may have arisen from difficulty in identifying the exact centre of the bob when measuring length. Air resistance and any slight movement of the pivot would also have damped the motion gradually, marginally lengthening the observed period.
Ensuring the release angle remained below 10° was important, since larger amplitudes would have increased the period beyond the small-angle prediction and biased g downwards. Repeating each timing three times helped to identify and reduce anomalous readings and improved overall precision.
The investigation successfully determined the acceleration due to gravity using a simple pendulum.
The period squared was found to vary linearly with length, confirming the hypothesis, and the resulting value of g was 9.79 m s⁻², within 0.2% of the accepted value of 9.81 m s⁻². The close agreement demonstrates that the linearised method provides a simple yet accurate means of measuring g.
Hughes, I.G. and Hase, T.P.A. (2010) Measurements and their Uncertainties: A Practical Guide to Modern Error Analysis. Oxford: Oxford University Press.
Serway, R.A. and Jewett, J.W. (2018) Physics for Scientists and Engineers with Modern Physics. 10th edn. Boston, MA: Cengage Learning.
Young, H.D. and Freedman, R.A. (2016) University Physics with Modern Physics. 14th edn. Harlow: Pearson Education.

All work is written by human writers. 100% AI free, guaranteed.

100% money back guarantee if you find plagiarism in our work.
COMPANY DETAILS