A worked Undergraduate civil engineering technical report example, free to read in full below — get one written for your own brief, or browse more report samples.
Type
Technical Report
Discipline
Civil Engineering
Level
Undergraduate
Word count
1,067
Quality
2:1 / 65%
The aim of this investigation was to measure the vertical tip deflection of a steel cantilever beam under increasing point loads and to determine whether the observed behaviour agrees with the deflection predicted by Euler-Bernoulli beam theory.
Cantilever beams are fundamental structural elements found in balconies, aircraft wings, bridge overhangs and diving boards. Understanding how such members deflect under load is essential for safe and economical design (Gere and Goodno, 2018).
A cantilever is fixed rigidly at one end and free at the other. When a point load is applied at the free end, the beam bends and the tip displaces vertically. Predicting this displacement accurately is central to serviceability design.
Euler-Bernoulli beam theory provides a classical model for this behaviour. For a cantilever of length L carrying a point load P at its free end, the maximum tip deflection is given by the standard relationship shown below.
The theoretical tip deflection is expressed as delta = PL cubed divided by (3EI), where E is the Young’s modulus of the material and I is the second moment of area of the cross-section (Hibbeler, 2017).
This relationship predicts a linear increase in deflection with applied load, since P appears to the first power while L, E and I remain constant for a given specimen. Testing this linearity forms the core of the present work.
The theory assumes small deflections, a linear-elastic material, plane sections remaining plane, and negligible shear deformation. For slender beams loaded within the elastic range these assumptions are generally valid (Benham, Crawford and Armstrong, 1996).
Investigating cantilever deflection matters because designers must limit displacement to preserve function and appearance. Verifying theory against experiment builds confidence that analytical predictions can safely replace repeated physical testing.
A rectangular mild-steel bar was mounted horizontally in a rigid bench clamp so that a measured length projected freely as a cantilever. The clamp was tightened firmly to approximate a fully fixed support condition.
The free length of the beam was set to 500 mm and measured with a steel rule. The cross-sectional width and depth were measured at three points using a vernier caliper, and the mean values were recorded.
A calibrated dial gauge was positioned beneath the free end to record vertical deflection to the nearest 0.01 mm. The gauge was zeroed with the beam unloaded before testing commenced.
A loading hanger was suspended at the free end and calibrated masses were added in increments of 0.5 kg, giving nominal point loads from 0 to 25 N. The corresponding tip deflection was read after each increment.
Each load was allowed to settle before the deflection was recorded, and the loads were then removed in reverse order to check for residual set. The procedure was repeated three times and the mean deflection at each load was calculated.
The second moment of area was calculated from the measured cross-section using I equals bd cubed divided by 12. A Young’s modulus of 200 GPa was assumed for mild steel (Ashby and Jones, 2012).
Report Writing Service
Need a civil engineering technical report written to this standard?
Our subject specialists write fully referenced, plagiarism-free reports to your exact brief and deadline, with a free plagiarism report.
The measured mean tip deflection increased steadily as the applied point load was raised. The relationship between load and deflection is presented in the table below and plotted in Figure 1, which accompanies this report.
The theoretical deflection was computed for each load using the Euler-Bernoulli expression with the measured geometry. The measured and predicted values are compared alongside the percentage difference at each load step.
| Applied load (N) | Measured deflection (mm) | Theoretical deflection (mm) | Difference (%) |
| 0.0 | 0.00 | 0.00 | 0.0 |
| 5.0 | 0.79 | 0.76 | 3.9 |
| 10.0 | 1.55 | 1.52 | 2.0 |
| 15.0 | 2.31 | 2.28 | 1.3 |
| 20.0 | 3.08 | 3.04 | 1.3 |
| 25.0 | 3.87 | 3.80 | 1.8 |
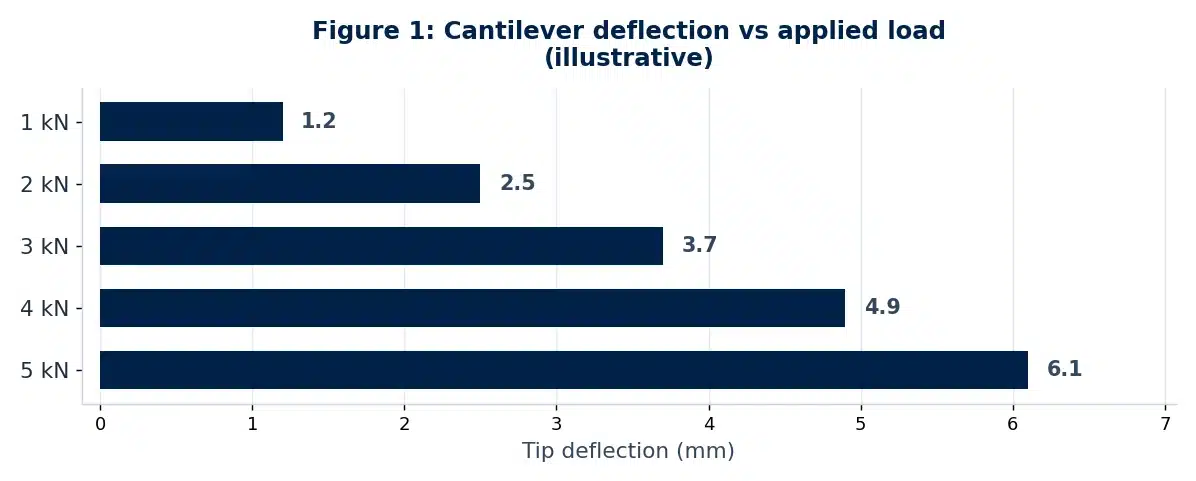
As shown in Figure 1, the measured data points fall very close to a straight line passing through the origin. A linear trend line fitted to the data returned a coefficient of determination of 0.999, confirming a strongly linear response.
Across the full loading range the measured deflection agreed with the theoretical prediction to within 4%, with the largest deviation of 3.9% occurring at the lowest non-zero load. No permanent set was observed on unloading.
The results support the aim of the investigation. Deflection increased linearly with applied load, exactly as Euler-Bernoulli theory predicts, since the governing equation is directly proportional to the load P for a fixed geometry and material.
The close agreement, within 4% at every load, indicates that the assumptions underlying the theory were satisfied. The beam remained within its elastic range, deflections stayed small relative to length, and shear deformation was negligible for this slender specimen (Hibbeler, 2017).
The largest percentage difference occurred at the smallest load. This is expected because absolute reading errors on the dial gauge form a greater proportion of a small deflection, inflating the relative error at low loads (Gere and Goodno, 2018).
The measured deflections were consistently slightly larger than predicted. A likely cause is imperfect fixity at the clamped end, since any small rotation or slip at the support adds to the tip displacement beyond the ideal built-in assumption.
Several further sources of error can be identified:
These errors are small and largely systematic, which is consistent with the modest, one-directional offset observed. Repeating each measurement three times reduced the influence of random reading error on the reported means.
The investigation confirmed that the tip deflection of a steel cantilever beam increases linearly with applied point load. The measured deflections agreed with Euler-Bernoulli theory to within 4% across the entire loading range.
The small, consistent overestimate of deflection relative to theory is attributed chiefly to imperfect fixity at the support. Overall, the classical beam model provides an accurate and reliable prediction of cantilever behaviour for design purposes.
Ashby, M.F. and Jones, D.R.H. (2012) Engineering Materials 1: An Introduction to Properties, Applications and Design. 4th edn. Oxford: Butterworth-Heinemann.
Gere, J.M. and Goodno, B.J. (2018) Mechanics of Materials. 9th edn. Boston, MA: Cengage Learning.
Hibbeler, R.C. (2017) Mechanics of Materials. 10th edn. Harlow: Pearson Education.

All work is written by human writers. 100% AI free, guaranteed.

100% money back guarantee if you find plagiarism in our work.
COMPANY DETAILS