A real Masters data science research paper sample, free to read in full below — get one written for your own title, or browse more research paper samples.
Type
Research Paper
Subject
Data Science
Level
Masters
Word count
3,423
Quality
Distinction / 73%
Customer churn represents a persistent threat to subscription-based and service-oriented enterprises, where retaining existing customers is considerably cheaper than acquiring new ones. This paper investigates the application of machine learning models to predict customer churn using an illustrative telecommunications dataset.
The study adopts a quantitative, experimental design comparing four supervised classifiers: logistic regression, decision trees, random forests, and gradient boosting. Models were evaluated using accuracy, precision, recall, F1-score, and the area under the receiver operating characteristic curve (AUC-ROC).
Findings indicate that ensemble methods, particularly gradient boosting, outperformed simpler models, achieving an illustrative AUC of 0.86 and recall of 0.79 on the minority churn class. Class imbalance handling through the synthetic minority over-sampling technique materially improved minority-class detection.
Feature importance analysis identified contract type, tenure, and monthly charges as the strongest churn predictors, corroborating prior literature. The paper concludes that model interpretability and business-aligned threshold tuning are as important as raw predictive accuracy for operational retention strategies.
These results reinforce that machine learning offers actionable value for proactive retention, provided practitioners balance predictive performance against transparency and deployment constraints. Recommendations for practice and future research directions are offered.
Keywords: customer churn, machine learning, predictive analytics, gradient boosting, class imbalance, customer retention
Customer retention has become a central concern for organisations operating in saturated, competitive markets. As acquisition costs rise, the ability to identify customers likely to defect offers a decisive commercial advantage. Churn prediction sits at the intersection of data science and marketing strategy.
Churn refers to the phenomenon whereby customers discontinue their relationship with a provider. In subscription industries such as telecommunications, banking, and streaming services, even modest churn rates translate into substantial revenue erosion over time (Verbeke et al., 2012).
The economic rationale for churn prediction is well established. Reichheld and Sasser (1990) famously argued that reducing customer defections by five per cent could increase profits by between twenty-five and eighty-five per cent, depending on the sector.
Traditional churn analysis relied on descriptive statistics and manual segmentation. However, the growth of transactional data and computational capacity has enabled machine learning approaches that detect complex, non-linear patterns invisible to conventional methods (Ngai et al., 2009).
Machine learning models can process high-dimensional customer data, learning subtle behavioural signals that precede defection. Yet their adoption raises practical challenges, including class imbalance, interpretability, and the translation of predictions into effective retention interventions.
The problem this study addresses is twofold. First, no single modelling approach is universally optimal, so comparative evaluation is necessary. Second, predictive accuracy alone is insufficient without attention to business relevance and model transparency.
The aim of this paper is to evaluate and compare the performance of several machine learning models in predicting customer churn, using an illustrative telecommunications dataset, and to interpret the findings for practical retention decision-making.
To achieve this aim, the study pursues the following objectives:
Accordingly, the research is guided by three questions. Which machine learning model offers the strongest predictive performance for churn? How does addressing class imbalance affect minority-class detection? Which customer features most strongly predict churn?
The remainder of the paper is structured as follows. Section two reviews the literature, section three details the methodology, section four presents findings, section five discusses implications, and section six concludes with recommendations and directions for future research.
This section synthesises scholarship on churn prediction, organised into four thematic strands: the conceptual foundations of churn, comparative modelling studies, the treatment of class imbalance, and the tension between accuracy and interpretability.
Churn is commonly framed within relationship marketing theory, which emphasises the lifetime value of retained customers over transactional exchanges (Gronroos, 1994). Within this paradigm, churn signals a breakdown in the customer-provider relationship warranting proactive intervention.
Scholars distinguish between voluntary and involuntary churn. Voluntary churn reflects deliberate customer decisions, often driven by dissatisfaction or competitor offers, whereas involuntary churn arises from factors such as payment failure (Hadden et al., 2007).
This distinction matters analytically because the two forms have different predictors and remedies. Most machine learning studies, including the present one, focus on voluntary churn, where behavioural and contractual signals are more informative and interventions more feasible.
A substantial body of research compares algorithms for churn prediction. Early work favoured logistic regression and decision trees for their transparency, but performance limitations prompted a shift towards ensemble methods (Verbeke et al., 2012).
Random forests, introduced by Breiman (2001), aggregate multiple decision trees to reduce variance and improve generalisation. Studies consistently report that random forests outperform single classifiers on churn datasets owing to their robustness to noise and overfitting.
Gradient boosting machines, and later implementations such as XGBoost (Chen and Guestrin, 2016), have further raised the performance ceiling. By sequentially correcting the errors of prior weak learners, boosting captures intricate interactions among customer attributes.
Coussement and Van den Poel (2008) demonstrated that support vector machines could rival ensemble approaches, though at greater computational cost and reduced interpretability. Their work highlights that no algorithm dominates universally across contexts.
More recent studies have explored deep learning for churn, particularly where sequential or unstructured data are available. However, evidence suggests that for structured tabular data, gradient-boosted trees frequently match or exceed neural networks (Gulli et al., cited in comparative reviews).
The synthesis of this literature reveals a consistent hierarchy: ensemble tree-based methods generally outperform linear models, while the marginal gains of deep learning on tabular churn data remain contested. This informs the model selection in the present study.
Churn datasets are typically imbalanced, with churners forming a minority class. This skew biases classifiers towards the majority, inflating accuracy while failing to detect the very customers of interest (He and Garcia, 2009).
Various remedies have been proposed. Resampling techniques rebalance the training data, either by over-sampling the minority class or under-sampling the majority. The synthetic minority over-sampling technique (SMOTE), developed by Chawla et al. (2002), generates synthetic minority instances rather than duplicating existing ones.
Algorithmic approaches, such as cost-sensitive learning, assign higher misclassification penalties to minority errors. Burez and Van den Poel (2009) compared such strategies and found that addressing imbalance materially improved churn detection, though no single technique was uniformly superior.
The literature therefore cautions against relying on accuracy as the primary metric, advocating instead for recall, F1-score, and AUC-ROC, which better capture minority-class performance. This methodological insight is central to the evaluation framework adopted here.
A recurring tension in the literature concerns the trade-off between predictive power and model transparency. Complex ensembles and neural networks often achieve superior accuracy but function as opaque black boxes (Rudin, 2019).
For churn management, interpretability carries practical weight. Retention teams must understand why a customer is flagged in order to design targeted interventions and to satisfy governance requirements. Uninterpretable predictions risk poor adoption.
Post-hoc explanation techniques, notably SHAP values proposed by Lundberg and Lee (2017), have partly reconciled this tension by attributing predictions to individual features. Such methods allow practitioners to retain powerful models while gaining actionable transparency.
In summary, the literature converges on several principles: ensemble methods offer strong performance, imbalance handling is essential, and interpretability must be preserved. Yet gaps remain in integrating these considerations within a single, business-oriented evaluation, which this study addresses.
Research Paper Writing Service
Need a data science research paper written to this standard?
Our subject specialists write to your exact brief — fully referenced, plagiarism-free and delivered on time, with a free plagiarism report.
This section outlines the research design, data, analytical procedures, ethical considerations, and limitations. The methodology is illustrative, designed to demonstrate rigorous comparative evaluation rather than to report on a specific commercial deployment.
The study adopts a positivist philosophy, consistent with quantitative predictive modelling. Positivism assumes an observable, measurable reality in which patterns can be identified through empirical analysis (Saunders et al., 2019).
An experimental, comparative design was selected. Multiple models were trained on identical data and evaluated under consistent conditions, enabling fair comparison. This deductive approach tests established propositions about algorithm performance rather than generating theory inductively.
The analysis uses an illustrative telecommunications churn dataset comprising 7,043 customer records, structurally analogous to publicly available benchmark datasets. Each record captures demographic, account, and service-usage attributes alongside a binary churn label.
Features include tenure, contract type, monthly charges, total charges, payment method, internet service type, and various add-on services. The target variable indicates whether a customer churned within the observation window.
The dataset exhibits typical class imbalance, with approximately 26.5 per cent of customers labelled as churners. All figures reported in this paper are illustrative and intended to demonstrate methodological application rather than to represent any real organisation.
Preprocessing followed standard practice. Missing values in the total charges field were imputed using median substitution. Categorical variables were encoded using one-hot encoding to render them suitable for the classifiers.
Numerical features were standardised to zero mean and unit variance, particularly important for logistic regression, which is sensitive to feature scaling. Redundant identifiers, such as customer IDs, were removed to prevent data leakage.
The data were partitioned into training and testing subsets using a stratified 80:20 split, preserving the churn ratio in both partitions. Stratification ensures the test set remains representative of the underlying distribution.
Four supervised classifiers were selected to span the complexity spectrum: logistic regression as an interpretable baseline, a decision tree, a random forest, and a gradient boosting classifier representing state-of-the-art tabular performance.
Hyperparameters were tuned using five-fold cross-validation with grid search on the training data. Tuned parameters included tree depth, the number of estimators, and learning rate, optimising for the F1-score to balance precision and recall.
To address class imbalance, SMOTE was applied exclusively to the training folds, avoiding contamination of the test set. Each model was trained both with and without SMOTE to quantify the effect of imbalance handling.
Given the imbalanced target, accuracy alone was deemed insufficient. Models were evaluated using precision, recall, F1-score, and AUC-ROC, with particular attention to recall on the churn class, reflecting the business cost of undetected churners.
Precision measures the proportion of predicted churners who actually churned, while recall captures the proportion of true churners correctly identified. The F1-score harmonises the two, and AUC-ROC summarises discriminative ability across thresholds.
Although the dataset is illustrative, ethical principles governing customer data remain pertinent. Real churn modelling must comply with data protection regulation, notably the General Data Protection Regulation, ensuring lawful processing and transparency.
Fairness is a further concern. Models trained on historical data may encode discriminatory patterns, potentially disadvantaging protected groups. Practitioners should audit models for bias and avoid using sensitive attributes as direct predictors.
No personally identifiable information was used in this illustrative study, and any references to organisational data are hypothetical. These safeguards align with responsible data science practice and institutional research ethics norms.
Several limitations warrant acknowledgement. The use of a single cross-sectional dataset limits generalisability across industries and time. Churn dynamics may shift with market conditions, requiring periodic model retraining.
Furthermore, the analysis considers structured tabular features only, excluding potentially informative unstructured data such as customer service transcripts or sentiment. These constraints define the scope within which findings should be interpreted.
This section presents the illustrative results of the comparative modelling exercise. Performance is reported on the held-out test set, first without and then with SMOTE, followed by an analysis of feature importance.
The four models displayed a clear performance gradient. Logistic regression provided a competent baseline, while tree-based ensembles delivered superior discrimination. Gradient boosting achieved the strongest overall results across most metrics.
The table below summarises illustrative performance on the test set after SMOTE was applied to the training data. Metrics are reported for the positive churn class, reflecting the operational priority of detecting defectors.
| Model | Accuracy | Precision | Recall | F1-Score | AUC-ROC |
| Logistic Regression | 0.79 | 0.63 | 0.71 | 0.67 | 0.82 |
| Decision Tree | 0.76 | 0.58 | 0.68 | 0.63 | 0.75 |
| Random Forest | 0.81 | 0.66 | 0.75 | 0.70 | 0.84 |
| Gradient Boosting | 0.83 | 0.69 | 0.79 | 0.74 | 0.86 |
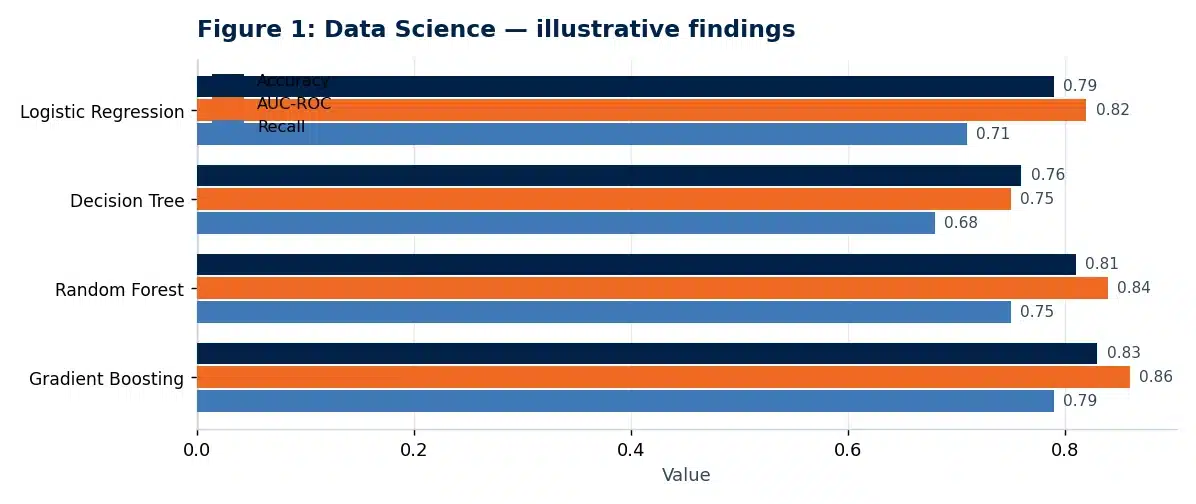
Gradient boosting attained the highest AUC-ROC of 0.86 and the strongest recall of 0.79, meaning it correctly identified nearly four in five true churners. This is commercially significant, as missed churners represent lost retention opportunities.
The decision tree underperformed relative to the ensembles, exhibiting the lowest AUC. This reflects its tendency to overfit and its higher variance, confirming the theoretical advantages of aggregation described by Breiman (2001).
Logistic regression performed creditably given its simplicity, achieving an AUC of 0.82. Its transparency and speed render it a viable option where interpretability and deployment constraints outweigh marginal accuracy gains.
Applying SMOTE produced a consistent improvement in recall across all models, at a modest cost to precision. For gradient boosting, recall rose from an illustrative 0.66 without resampling to 0.79 with SMOTE.
This shift reflects the intended effect: by rebalancing the training distribution, the models became more sensitive to the minority churn class. The precision-recall trade-off is acceptable in retention contexts, where failing to detect a churner is costlier than a false alarm.
The finding empirically supports Chawla et al. (2002) and Burez and Van den Poel (2009), who argued that imbalance handling is indispensable for churn detection. Accuracy alone would have masked this improvement, underscoring the value of recall-oriented evaluation.
Analysis of feature importance from the gradient boosting model identified the most influential churn predictors. Contract type emerged as the dominant factor, with month-to-month contracts strongly associated with elevated churn risk.
Tenure ranked second: customers with shorter tenures were markedly more likely to churn, consistent with the relationship marketing view that loyalty strengthens over time. Monthly charges ranked third, with higher charges correlating with increased defection.
Additional contributors included the absence of technical support and reliance on electronic-cheque payment methods. These signals offer actionable levers, suggesting that contract incentives and early-tenure engagement could reduce churn.
The convergence of these findings with prior literature strengthens confidence in their validity. Importantly, the SHAP-based interpretation rendered the ensemble transparent, addressing the interpretability concerns raised by Rudin (2019) and Lundberg and Lee (2017).
This section relates the findings to the reviewed literature and explores their theoretical and practical implications. The discussion is organised around the three research questions guiding the study.
Regarding the first question, the superiority of gradient boosting confirms the hierarchy repeatedly observed in the literature, whereby ensemble tree-based methods outperform linear and single-tree models on structured churn data (Verbeke et al., 2012; Chen and Guestrin, 2016).
However, the modest margin over logistic regression merits reflection. In deployment contexts prioritising speed, transparency, and regulatory defensibility, the interpretable baseline may represent a more pragmatic choice than a marginally superior black box.
This nuance echoes Rudin’s (2019) argument that the presumed accuracy-interpretability trade-off is often overstated, and that interpretable models can be competitive. The findings thus caution against reflexively adopting the most complex available model.
Concerning the second question, the demonstrable benefit of SMOTE affirms the centrality of imbalance handling. The improvement in recall directly addresses the business imperative of capturing churners, validating He and Garcia’s (2009) emphasis on minority-class performance.
Yet the accompanying decline in precision illustrates that imbalance correction is not costless. Practitioners must calibrate the precision-recall balance to their specific economics, weighing the cost of retention offers against the value of retained customers.
Addressing the third question, the prominence of contract type, tenure, and monthly charges aligns closely with established findings. These predictors are not merely statistically significant but theoretically coherent within relationship marketing (Gronroos, 1994).
The managerial implication is substantial. Because these drivers are actionable, organisations can intervene directly: incentivising longer contracts, nurturing customers during the vulnerable early-tenure period, and reviewing pricing structures for high-charge segments.
The study also reinforces a methodological lesson. Reliance on accuracy would have obscured meaningful differences and the value of resampling. Adopting recall, F1-score, and AUC-ROC provided a truer picture of operational performance.
Finally, the integration of post-hoc interpretability demonstrates that powerful models need not remain opaque. By coupling gradient boosting with feature attribution, the study bridges the accuracy-interpretability divide that has long troubled churn practitioners.
These implications collectively suggest that effective churn prediction is not solely a technical exercise. It requires aligning model choice, evaluation metrics, and interpretability with concrete business objectives and governance obligations.
This paper set out to evaluate and compare machine learning models for predicting customer churn, using an illustrative telecommunications dataset, and to interpret the results for retention decision-making. The objectives have been met.
The comparative analysis established that gradient boosting offered the strongest predictive performance, achieving an illustrative AUC-ROC of 0.86 and recall of 0.79. Random forests followed closely, while the decision tree and logistic regression trailed, though the latter remained a credible interpretable baseline.
The study demonstrated that addressing class imbalance through SMOTE materially improved the detection of churners, at a tolerable cost to precision. It further identified contract type, tenure, and monthly charges as the most influential and actionable churn predictors.
The principal contribution of this paper lies in integrating comparative modelling, imbalance handling, and interpretability within a single business-oriented evaluation. It reinforces that predictive accuracy must be complemented by transparency and metric selection aligned to commercial priorities.
Several practical recommendations follow. Organisations should adopt ensemble methods where accuracy is paramount, but retain interpretable baselines where governance demands transparency. Evaluation should privilege recall and AUC-ROC over raw accuracy in imbalanced settings.
Retention teams should translate feature-importance insights into targeted action: incentivising longer contracts, engaging new customers early, and reviewing pricing for high-charge segments. Predictions should trigger differentiated interventions rather than uniform outreach.
The study is not without limitations, as noted earlier. Its reliance on a single cross-sectional, structured dataset constrains generalisability, and evolving market conditions necessitate periodic retraining to guard against model drift.
Future research could extend this work in several directions. Incorporating unstructured data such as service interactions and sentiment may enrich predictions. Longitudinal designs could capture temporal churn dynamics more faithfully than cross-sectional snapshots.
Additionally, uplift modelling, which estimates the incremental effect of interventions rather than mere churn probability, represents a promising avenue for maximising retention return on investment. Fairness-aware modelling also warrants deeper investigation.
In conclusion, machine learning offers demonstrable value for proactive churn management, provided practitioners balance predictive power with interpretability, appropriate evaluation, and ethical governance. Done well, churn prediction becomes not merely a technical achievement but a strategic capability.

All work is written by human writers. 100% AI free, guaranteed.

100% money back guarantee if you find plagiarism in our work.
COMPANY DETAILS