Here is a sample that showcases why we are one of the world’s leading academic writing firms. This assignment was created by one of our expert academic writers and demonstrated the highest academic quality. Place your order today to achieve academic greatness.
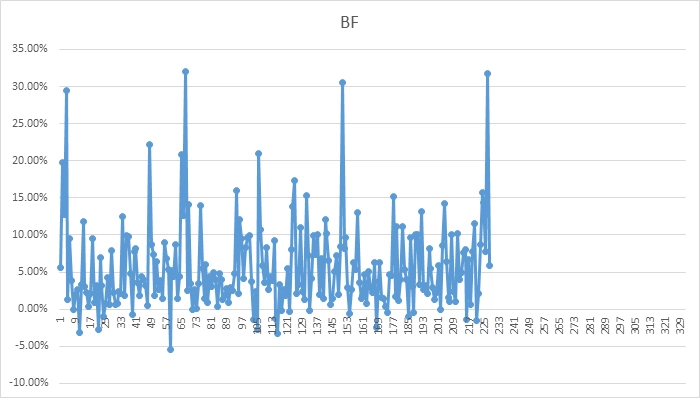
The graphs below show the distribution companies’ operating margins before implementing BEPS. In this manner, it can be determined that the operating margin of the distribution companies was more inclined towards the positive figure before the implementation of BEPS than the negative figure. This shows that the OM of distribution companies was satisfactory before BEPS.
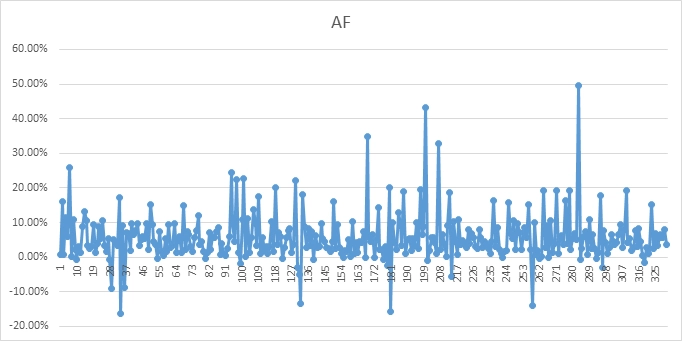
The figure below shows the OM of distribution companies after implementing BEPS. In this regard, it can be determined that OM of the distribution companies declined after implementing BEPS. It is because most of the values are negative, and the trend of the graph has also decreased. This shows that the operating margin of the distribution companies decreased after the implementation of BEPS.
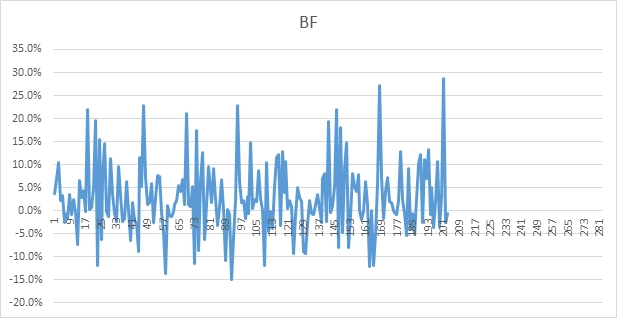
The below graph shows the OM of the manufacturing companies before implementing BEPS. In this manner, it can be determined that the OM of the manufacturing companies was more inclined towards the positive values than the negative ones. This shows that the OM of manufacturing companies was satisfactory before the implementation of BEPS.
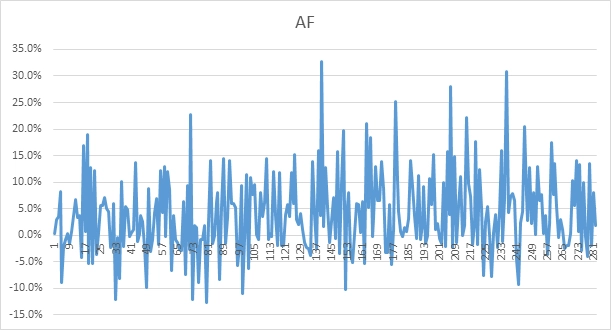
The below graph shows the OM of manufacturing companies after implementing BEPs. In this manner, it can be determined from the below graph that the OM of the manufacturing companies increased after the implementation of BEPS, as evident from the trend line below the graph. These values were more positively inclined towards the positive figures depicting the increased performance of the manufacturing companies after the implementation of BEPS.
The two-sample t-test is conducted on the data sets of two independent populations with unequal variances (Derrick et al., 2018). However, this test can be two-tailed or one-tailed, depending on whether the test of two population means is greater than the other or different. In this manner, the two-sample t-test with unequal variances has been applied in the context of distribution companies to determine the difference in mean and whether there is any increase in the OM after BEPS implementation. The hypothesis of the two-sample t-test with unequal variances is provided below:
H0: There is no significant difference in the means of each sample.
H1: There is a significant difference in the means of each sample.
The below table shows the results of a two-sample t-test with unequal variances in the context of distribution companies. In this manner, it can be determined that the mean before the implementation of BEPS was 0.055, while it was 0.056 after the implementation of BEPS. This shows there is a difference in the mean value. However, the sig value at one-tail is computed to be 0.38 above 0.05. Thus, the null hypothesis cannot be rejected that there is no difference in the means of each sample. On the other hand, the sig value at two tails is computed to be 0.76, showing that population means are not greater than the other.
Orders completed by our expert writers are

| BF | AF | |
| Mean | 0.055175 | 0.056828 |
| Variance | 0.003405 | 0.004788 |
| Observations | 228 | 331 |
| Hypothesized Mean Difference | 0 | |
| df | 535 | |
| t Stat | -0.30477 | |
| P(T<=t) one-tail | 0.380331 | |
| t Critical one-tail | 1.647707 | |
| P(T<=t) two-tail | 0.760663 | |
| t Critical two-tail | 1.964408 |
Similarly, a two-sample t-test with unequal variances has also been applied to manufacturing companies. It can be determined from the below table that the mean value before BEPS implementation is 0.027 while it was 0.04 after the implementation. This shows a difference in the mean values. Similarly, the sig value at one-tail is computed to be 0.030 below 0.05 and shows the significant difference in the mean of two samples. Thus, the null hypothesis that there is no difference in the means of each sample has been rejected. On the other hand, the sig value at two tail is computed to be 0.061 which is above 0.05 showing no increase in the means of both the samples. Thus, it can be stated that there has been an insignificant increase in both the samples.
| BF | AF | |
| Mean | 0.027264183 | 0.040076 |
| Variance | 0.005567475 | 0.005443 |
| Observations | 203 | 282 |
| Hypothesized Mean Difference | 0 | |
| df | 432 | |
| t Stat | -1.874272543 | |
| P(T<=t) one-tail | 0.030783761 | |
| t Critical one-tail | 1.648388493 | |
| P(T<=t) two-tail | 0.061567523 | |
| t Critical two-tail | 1.965470509 |
Anova or variance analysis can be used to compare the means between more than two or two groups of values (Mishra et al., 2019). This test can be used to compare the means of two different groups. In this manner, the Anova single factor has been applied in the context of distribution companies. The below table shows the summary statistics of the groups being considered. The mean value determined before the implementation of BEPS is 0.055 while the mean value after the implementation was 0.056.
| Groups | Count | Sum | Average | Variance |
| BF | 228 | 12.58 | 0.055175 | 0.003405 |
| AF | 331 | 18.81004 | 0.056828 | 0.004788 |
The below table shows the statistics of Anova single factor through which it is evident that F-statistics is computed to be 0.087 while the sig value was computed to be 0.76 which is above 0.05. This shows the insignificant difference in the means of two groups.
| Source of Variation | SS | df | MS | F | P-value | F crit |
| Between Groups | 0.000369 | 1 | 0.000369 | 0.087272 | 0.767784 | 3.858208 |
| Within Groups | 2.352953 | 557 | 0.004224 | |||
| Total | 2.353322 | 558 |
Similarly, the Anova single factor was carried out for the manufacturing companies. The table below of summary statistics shows that the mean before the implementation of BEPS was 0.027 while the mean after the implementation was 0.04. This shows the difference in the mean values.
| Groups | Count | Sum | Average | Variance |
| BF | 203 | 5.534629 | 0.027264 | 0.005567 |
| AF | 282 | 11.30151 | 0.040076 | 0.005443 |
The table below shows that the f-statistics is computed to be 3.525 while the sig value is determined to be 0.061 which is also above the threshold of 0.05. Thus, it can be inferred that there is no significant difference in the mean value of both the groups.
| Source of Variation | SS | df | MS | F | P-value | F crit |
| Between Groups | 0.019375131 | 1 | 0.019375 | 3.525873 | 0.06102 | 3.860783 |
| Within Groups | 2.654148079 | 483 | 0.005495 | |||
| Total | 2.67352321 | 484 |
Derrick, B., Ruck, A., Toher, D. and White, P., 2018. Tests for equality of variances between two samples contain both paired and independent observations. Journal of Applied Quantitative Methods, 13(2), pp.36-47.
Mishra, P., Singh, U., Pandey, C.M., Mishra, P. and Pandey, G., 2019. Application of student’s t-test, analysis of variance, and covariance. Annals of cardiac anaesthesia, 22(4), p.407.
To write the introduction chapter of a dissertation:

All work is written by human writers. 100% AI free, guaranteed.

100% money back guarantee if you find plagiarism in our work.
COMPANY DETAILS


