7 Statistical Analysis Techniques For Beginners
Published by at August 26th, 2021 , Revised On October 9, 2023
When carrying out dissertation statistical analyses, many students feel that they have opened up a Pandora’s Box. Some of the common issues that cause such frustration in the dissertation statistical analyses include a poorly developed methodology or even an inadequately designed research framework. But if the foundation of your research is completed logically, then statistical analysis becomes much more manageable. There are some statistical analysis tools and techniques that are quite basic but get the job done in a time-efficient manner. This article provides details of the 7 statistical analysis techniques for beginners that will definitely help you with your dissertation statistical analysis particularly if this is the first time you are analysing research data.
While most students find it easy to collect data through primary and secondary research techniques, they struggle with the data analysis aspect of their dissertation. It is important to realise that the success of your dissertation project lies in the analysis & findings chapter. If your data analysis is strong and meaningful, you are more likely to secure a higher academic grade.
Analysing quantitative and qualitative data can become even more challenging if you are not familiar with common statistical analysis techniques. If you find yourself in such a situation don’t be afraid to ask for help with data analysis for the dissertation. All that hard work you put into the other chapters of your dissertation can’t be laid to waste only if you don’t the appropriate statistical analysis skills and expertise. Consulting professional statisticians and researchers will enable your study to become more meaningful and impressive.
7 Statistical Analysis Techniques For Beginners
We suggest that you start your data analysis off by considering the following seven statistical techniques before moving to more complex techniques for quantitative data.
1. Arithmetic Mean Statistical Analysis Technique
The arithmetic mean, or more commonly termed as the “average”, is the sum of a list of numerals divided by the number of items on the list. The mean is part of a family of measures of central tendency. Central tendency measures show us the extent to which observations are able to cluster around a central location. Mean has the ability to be influenced greatly by extreme variables in research. The mean is useful for statistical analysis because it allows the researcher to determine the overall trend of a data set and it can also give you a quick snapshot of the researcher’s data. The mean is quick and easy to calculate, either by hand or data analysis programmes like SPSS, Excel, and Matlab. The mean can be calculated using the formula where x is each observation, and n is the number of observations.
2. Standard Deviation Statistical Analysis Technique
The standard deviation is represented with the Greek symbol σ and is the measure of variability or dispersion of data around the mean. It basically is the measure of volatility which is the difference between the actual and the average value. Essentially, standard deviation measures the difference of individual data points from the mean. It enables the researcher to square the differences so that the positives and negatives of all variables become positive and takes the average of these squared differences. A higher standard deviation means that the data is spread more widely from the mean, whereas a low standard deviation shows that more data is aligned with the mean.
What data collection method best suits your research?
- Find out by hiring an expert from ResearchProspect today!
- Despite how challenging the subject may be, we are here to help you.


3. Skewness Statistical Analysis Technique
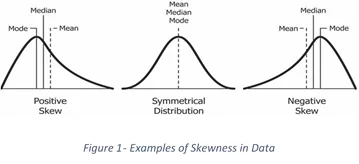
The distribution of data is important to measure. Some of the distributions of data are symmetric like the commonly viewed bell curve. But not all data can be symmetric, causing the distribution to move from the left or right of the bell curve, often known as asymmetric data. Skewness is the measure of how asymmetric distribution is. The mean, median and mode are all measures of the centre of a set of data, therefore, the skewness of the data can be determined by how these quantities are related to one another (See Figure 1). When including this measure in your dissertation it can be subjective to simply determine how skewed your data is just by looking at the graph of distribution. Hence, it becomes imperative to numerically calculate skewness. The most time-tested and reliable method of doing so is with Pearson’s first coefficient of skewness.
4. Hypothesis Testing Statistical Analysis Technique
Hypothesis testing, also commonly termed as t testing, assesses if a specific premise is actually true for the data set or population. Hypothesis testing is a process for making logical decisions about the reality of the observed effects. Under this form of testing, the researcher considers the results of a hypothesis test to be statistically significant, that is, if the results couldn’t have happened at random chance. Hypothesis testing can be conducted using programmes like SPSS and MiniTab for basic statistics learners.
5. Regression Statistical Analysis Technique
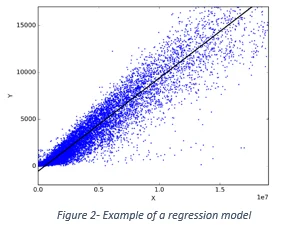
There are several subtypes of regressions, but here we will take a look at the simple linear regression. In general, regression techniques enable the researcher to develop models that depict the relationships between dependent and explanatory variables that are commonly charted on a scatterplot (See figure 2). Linear regression is a method to predict a target variable by fitting the “best linear relationship” between your dependent and independent variable. Simple linear regression uses a single independent variable to predict the dependent variable simply by fitting the best linear relationship. The direction of the line on the regression model enables the researcher to determine if the relationship is weak or strong.
6. Correlation Statistical Analysis Technique
Correlation analysis is a technique in statistics used to study the strength of a relationship between two continuous variables that are measured numerically. Researchers can use correlation analysis to determine the strength and the direction of a relationship. This can be easily calculated through the use of a correlation coefficient and while the direction line is determined through the trend data on a graph. Through the use of correlation analysis, you can investigate the naturally occurring variables that may be impractical to investigate using other research methods.
7. Monte Carlo Simulation Statistical Analysis Technique
If you really want to up your analysis game, try using a Monte Carlo Simulation. It is one of the most popular ways to calculate the effect of unpredictable variables on a specific factor. In the Monte Carlo simulations, you can use probability modelling to predict risk and uncertainty. This particular technique is often used to test a hypothesis or a scenario through random numbers and data to staging various possible outcomes to any situation based on any results. By testing various possibilities, the researcher is able to understand how random variables could impact the variables of the study.
These were 7 statistical analysis techniques for beginners that can be used to quickly and accurately analyze data. They are the most basic statistical techniques that beginners can use in examining their research data. Once the most basic statistical techniques are mastered, you can move on to more advanced techniques to look for complex patterns in your data.
How ResearchProspect Can Help?
Whether you are an undergraduate, Master’s, or PhD student, our expert statisticians can help you with every bit of your statistical analysis to help you improve the overall standard of your dissertation paper. Regardless of how urgent and complex your statistical analysis needs might be, we have a large team of statistical analysis consultants and so we will be able to assign a suitable expert to your statistical analysis order.
Frequently Asked Questions
The best statistical analysis technique depends on your specific research question and data type. Common choices include regression analysis, t-tests, ANOVA, or chi-square tests, chosen based on your study design and goals.