


Sample Masters Big Data Full Dissertation
Here is a sample that showcases why we are one of the world’s leading academic writing firms. This assignment was created by one of our expert academic writers and demonstrated the highest academic quality. Place your order today to achieve academic greatness.
Investigating the Impact of Big Data on Automobile Industry Operations
Abstract
The current study uses a quantitative research approach to analyze how Big Data initiatives impact the operation functions of automobile companies in the UK.
The research used a survey as the research instrument to gather data from 132 participants working in automobile companies in the UK. The survey looked to examine the opinions that executives had held about Big Data and how it impacted the company.
The survey was distributed online to individuals that worked for automobile companies in the UK using Survey Monkey. The data obtained were then analyzed using descriptive statistics to find factors that may be influencing the use of Big Data in automobile companies.
Based on these results, it is concluded that more significant investments in Big Data bring about positive impacts. The results presented conclude that investing more than 1 billion GBP on Big Data initiatives would provide greater tangible benefits for a business and positively impact the company.
The results also found that companies with greater analytical abilities on the adequate and above adequate range could see measurable results. In the end, Big Data did have a positive and large impact on the operations business function of automobile companies.
Chapter 1: Introduction to the Research Topic
Introduction
Big Data is recently on the rise as imperative information and tools need to be incorporated into businesses and daily life. Pflugfelder (2013) defines Big Data as large in volume, high in velocity, extensive in its variety, unable to be handled using conventional systems like relational databases, and needs unique and advanced technology for storage management analysis and visualization.
However, the actual definition of Big Data varies from industry to industry and business to business. Schroeck et al. (2012) found in their research that 18 percent of businesses defined Big Data as a vast source of information, 15 percent of companies named it as real-time information, and seven percent of these businesses considered Big Data as a source of information from social media.
By combining these demarcations, the resultant is a definition that portrays Big Data as a source of information that can be structured, unstructured, and semi-structured, which needs new technology, tools, and techniques for its storage, processing, analysis, and visualization for a large volume of data that is emitted at high speed and variety.
Significance of the Research Area
The automobile industry is increasingly becoming competitive in sustaining economies, especially with fierce competition between Western and Eastern manufacturers (Wallner and Kriglstein 2013).
The industry has had a significant impact on regional and world economies and societies (Lee et al., 2014). To capture a large chunk of the market and consumers’ interest in an increasingly competitive market, it is crucial to make decisions based on real-time data.
For this reason, many automobile companies around the world have begun to integrate Big Data into their decision-making process that ranges from manufacturing to marketing.
Walker (2015) has found that integrating Big Data into business-related tasks in the automobile industry can be accomplished through the following;
• Recalculating entire risk assortments within minutes
• Identifying fraudulent behaviour quickly, which might affect the automobile industry.
• Regulating root causes of problems, issues, failures, and defects could affect the longer term and shorter term.
• Generating sales based on market research of consumer behaviour.
With automobiles being an intricate part of developed society, it becomes mandatory for companies to ensure that they are providing quality products for the masses.
Big Data can play a significant role in the business activities of automobile companies. With changing consumer behaviour and more informed consumers, it has become essential for companies to integrate real-time information into business decisions.
Problem Statement
Automobile manufacturing in the UK has become a vital part of its economy. According to the Society of Motor Manufacturers and Traders (2016), there were 2.63 million cars registered in 2015, which increased six percent from 2014.
Due to the rapid changes and developments in the automobile industry, Big Data analysis has become vital to ensure new success levels in this revolutionary period. For this reason, the current study looks to understand the significance that Big Data plays in the Automobile industry.
To compete in an already competitive environment, it has become necessary for businesses to understand the value that Big Data can bring to them.
This makes it imperative for Big Data users to make decisions that can bring a competitive edge to the business, or else integrating Big Data becomes of use now. Schroeck et al. (2012) find that a vast deal of available data to companies is commonly unrelated. It comes from various data sources such as sensors, mobiles, transactions, social medial, log files, audio, video, images, and emails.
The processing of such large amounts of data to produce meaningful decisions has become critical for businesses to thrive and succeed in markets where consumer trends cannot change rapidly (Shah et al., 2014).
The automobile industry in the UK needs to improve its decision-making process to advance critical operations to compete in a highly competitive regional and international market.
Monaghan (2016) notes that the British car industry has been enjoying prolonged periods of growth, as witnessed with a car production increase in June 2016 that rose by 10.4% to 159,000 cars, the highest since June 1998.
According to the Society of Motor Manufacturers and Traders (SMMT), by 2017, the UK has the possibility of building a record number of vehicles per year that may overtake France and Spain to become Europe’s second-largest producer after Germany (Foy 2014).
However, Foy (2014) points that such success may be hindered due to the eroding supply chain and operations of the British car industry, primarily smaller companies that provide parts and electronic components that go into cars, making it the biggest concern of the industry.
To overcome these concerns, many are looking towards including more efficient data that may help industry leaders make better decisions for more prosperous businesses (Shooter 2013).
Research Aim and Objectives
Big Data is now widely being used in the automobile industry to take quick actions, saving time and cost prices. Understanding how the automobile industry can integrate the analysis of Big Data into its daily operations has become imperative to improve its integration and ensure that Big Data is being used correctly to obtain the maximum benefit from it. Therefore, the following research question has been formulated.
How has Big Data Impacted the UK Automobile Industry’s Operations?
Based on the research question, the research’s main aim is to investigate the impact of Big Data on the automobile industry, specifically in the UK, operations such as sales, customer retention, the manufacturing process, performance, marketing, logistics, and supply chain management.
To achieve the research aim and answer the research question, the following objectives have been developed.
• Assess the impact of Big Data on sales of automobiles and their marketing.
• Assess the impact Big Data has on ensuring customer retention.
• Examine how Big Data has revolutionized the automobile industry in the Uk and increased the potential use for business analytics.
• Assess the impact that Big Data can have on improving the performance and efficiency of an automobile company.
Research Approach
The current study will be conducted using a qualitative research approach. Based on the sections above, the study’s aim and objectives have been developed to pursue the study’s research question using the proposed research approach. To build a research approach, a literature review was conducted to understand previous studies that have attempted to analyze Big Data’s influence in various industries. The results of the literature review (i.e., chapter two) aided in building the research approach. Under this approach, primary research is conducted using semi-structured interviews as the research instrument for data collection. The justification of this approach will be discussed in detail in chapter three of the study.
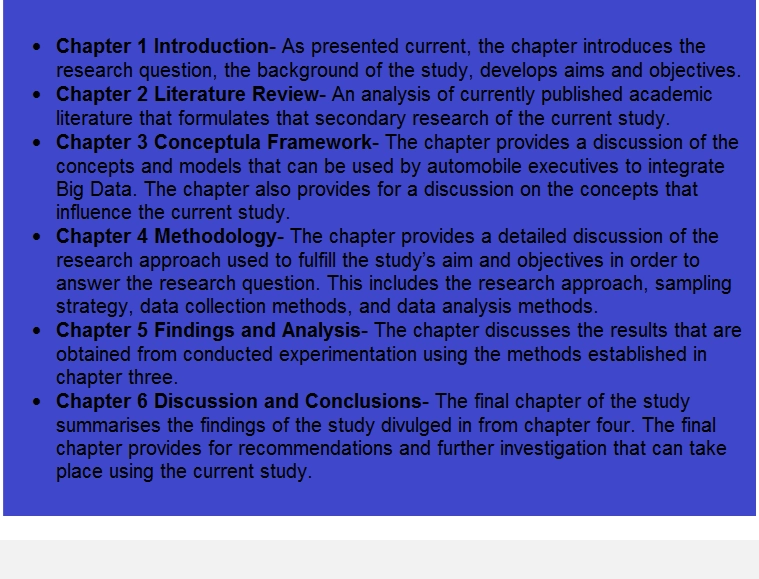
Project Outline
The current study is divided into six chapters. Below is the outline of the study;
Conclusion
Big Data has been influential in the 21st century by providing industries and companies with detailed information to make more intelligent business decisions. Very little research has been conducted on how Big Data impacts the automobile industry. Therefore, the current study aims to analyze and comprehend how Big Data impacts the UK automobile industry in influencing operations, sales, marketing, and other business aspects. For this purpose, the study developed a set of objectives that will be used to fulfil the study’s aim and the primary research question. The study is structured according to a qualitative research approach. Building the research approach designated the need for a literature review presented in the next chapter (i.e., Chapter two).
Chapter 2: Literature Review
Introduction
The literature review chapter is constructed based on systematic research principles to provide an in-depth analysis of previously published literature on topics related to the current research. The literature review will provide critical insight into various definitions relevant to developing the current research and its primary focus throughout the dissertation. To conduct this literature review, it was essential to search for relevant papers through various databases such as Wiley Online Library, Science Direct, IEEE Xplore Digital Library, and Google Scholar. For the current literature review, the chapter is divided into sections that answer the literature reviews research questions, which are as follows;
- How to have various other fields and domains, other than the automobile industry, used Big Data analytics and visual analytics?
- What are the types of data sources that have been reported in the literature?
- What are types of Big Data visualization techniques and tools for Big Data visual
analytics?
Previous literature that can provide understanding based on these questions was included in the literature review. Based on the analysis of the literature included, the methodology of the current research will be constructed.
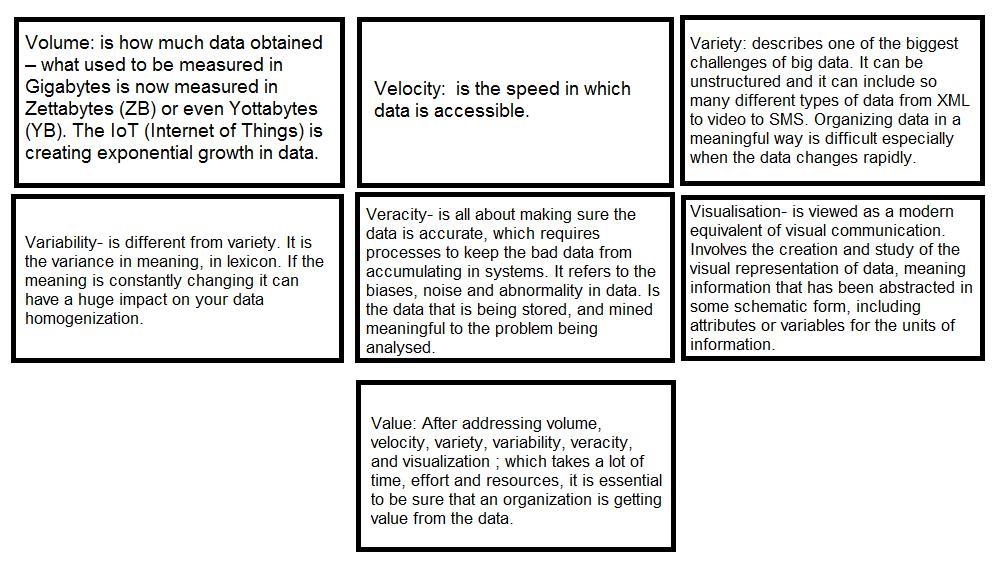
The 7V’s of Big Data
Big Data is defined using the 7V’s known as volume, velocity, variety, variability, veracity, visualization, and value.
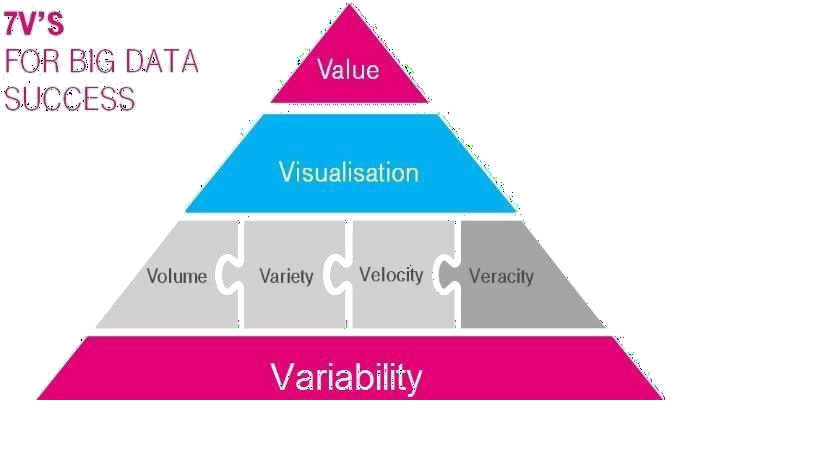
Figure 2.2-1: 7V’s of Big Data
Fields and Domains using Big Data and Visual Analytics
Based on the literature review, there are practically little to no publications available that portray the extent or detailed use of Big Data analytics in the automobile industry. However, many vital publications have noted that Big Data analytics is becoming a trend impacting businesses globally. Wozaniak et al. (2015) examined and determined to comprehend the type of data available to Volvo and how it was extracting such data. Based on the study, it is found that Volvo used data from its production planes and service centres to obtain data about their vehicles to assess information such as customer satisfaction, mileage coverage, and other vital factors that would improve decision making. Wozniak et al. (2015) found that Volvo uses data sources from logged production information; product specifications, client information, dealer information, product session information, telematics data, service history, repair history, warranties, and service contracts, which are then dispersed throughout the organization to specific departments, software teams, and engineers to use the data for production or operations improvements. Many other industries are also using Big Data analytics for their services and products.
Banking
Big Data analytics can have a profound impact on the future of banking industries. Collecting data at a massive scale can allow banks to comprehend the needs and expectations of their customers. However, banks lack the skills to execute and deploy significant data initiatives as they leverage more familiar technologies and software-development lifecycle (SDLC) methodologies. To develop analytic tools that experts in the banking industry comprehend, it is essential to meld together accurate data interpretation on a user-friendly interface. Commotion is an example of a Big Data analytics tool that keeps the user in mind. Commotion allows for a comfortable and easy experience for bank data exploration (Laberge, Anderson, et al., 2012). The analytics tool will enable analysts to drag and drop data collections that produce variable chart visualizations. The process is formally known as the “think loop process,” allowing analysts to dig and separate larger data collections to explore particular hypotheses based on smaller groupings to understand banks’ network anomalies (Laberge, Anderson, et al., 2012).
Transport
Implementing Big Data into the transportation industry has allowed it to become resilient in extreme scenarios. A large portion of the world’s population has shifted to urban living areas requiring cities to deliver sustainable, effective, and efficient services. Big data analytic research projects are currently commenced in the transportation industry to deal with massive data coming from roads & vehicle sensors, GPS devices, customer apps, and other websites. Ben Ayed et al. (2015) have reported using Big Data analytics in Dublin to improve the city’s public bus transportation network and reduce issues with increased traffic congestion. Using advanced analytics on the collected data, specific traffic problems were identified. The optimal time needed to start bus lanes was answered, and recommendations were made to add bus lanes (Ayed et al., 2015).
Ferreira, Poco et al.’s 2013 study provides insight into taxi trips to visually query taxi trips allowing taxi companies to make better decisions to schedule driver shifts and increase revenue. The use of Big Data analytics in transportation has also allowed policymakers to develop improved preparation plans and disaster management plans for high-risk events such as accidents, public gatherings, and natural disasters. Using smart card data and social media data, the resilience of transportation systems can be increased by analyzing changes in passenger behaviour, replaying historical events within the specific area to discover anomalous situations, and customer service (Itoh, Yokoyama, et al. 2014).
Types of Big Data Sources
Unlike typical data, Big Data contains videos, text, audio, images, and other forms of data collected from numerous datasets making it difficult to process with traditional database management tools giving rise to a new generation of tools specifically designed to analyze and visualization Big Data.
Santourian et al. (2014) observe that Big Data is often generated from transactions (i.e., invoices, payment orders, delivery records, and storage records) or unstructured data such as text extracts from websites, social media, or images.
However, Santourian et al. (2104) note that Big Data can also be collected in “real-time” from sensors such as those found in smartphones or from logs extracted from behaviour found online.
Big Data’s rawness due to the velocity by which it is being received oftentimes is unable to serve a statistical purpose as they have been collected by third parties who don’t emphasize data collection.
Big Data sources vary across industries as data collection needs to fit the purpose for they are to be used in the analysis. For example, Fiore et al. (2015) use data sources that have been made available by project partners or made available through national and international agencies developing a more static setup for Big Data analysis.
This included sources of data coming from satellite imagery, remote sensing data, hyperspectral imagery, and climate data used to formulate a use case infrastructure to analyze climate change trends in Manaus, Brazil (Fiore et al., 2015).
A study conducted by Baciu et al. (2015) has reported that use of sources that vary across fields, such as extracting data from a website known as a Bright kite that collects data from 4.5 million mobile users locations, such as their latitude and longitudes of each of the mobile users over specific intervals of time.
Studies that are less scientifically complex in theme use other sources of data; such as text sources which include words, phrases, and even entire documents extracted from social media platforms (i.e., Facebook) is used to analyze and predict events such as market trends, analyses product defects, and management of calamities (Fan and Gordon 2014; Mahmud et al. 2014).
Large companies also use various data sources to collect raw data to turn it into meaningful knowledge that can then be used to improve customer service, examine product defects, analyze organizational changes, and comprehend changing consumer trends (Heer and Kandel 2012; Kateja et al. 2014).
Volvo, an automobile manufacturer, uses data sources from logged product information; product specifications, client information, dealer information, product session information, telematics data, service history, repair history, warranties, and service contracts, which is then dispersed throughout the organization to specific departments/divisions, software teams, and engineers to use the data for improvements (Wozniak et al. 2015).
Big Data Visualization Techniques and Tools for Big Data Visual Analytics
Vatrapu et al. (2015) define data visualization as a method to communicate and transfer information clearly and effectively through graphical means. Given the rise of Big Data, analysts have begun to use data visualization methods to visualize, recognize, differentiate, interpret, and communicate configured data patterns based on the new visualization techniques specifically for massive datasets.
With new techniques, data scientists, analysts, and industry leaders benefit from comprehending massive amounts of data, recognizing emerging properties within the data, data quality control, feature detection on a small and large scale, and evidence for formulating hypotheses.
Generally, all visualization techniques and tools follow a similar pattern which includes the use of processing steps of data acquisition data transforming, mapping data onto visual models, and lastly, rendering or viewing the data (Zhang et al. 2013; Goonetilleke et al. Liu et al. 2015; Fu et al. 2014). Following is a brief discussion of visualization tools and techniques that have been used across diverse industries and studies to Big Data.
Conclusion
Popular domains that highly demand Big Data are healthcare, automobile, transport/Urban infrastructure, banking, and retail. The chapter also found sources through which the domains discussed retrieve vital information/data to use as meaningful knowledge. It is evident from the literature review that sources for retrieval of data diverge significantly from normal sources.
Firstly, the Big Data sources will contain massive data from sensors such as those on a phone that monitor health. With such massive data, it is necessary to follow specific steps laid out for Big Data analytics. Data analysis is done to the most microscopic level that a researcher can go with such tremendous amounts of data.
Finally, data visualization becomes necessary for producing information that can be used to help in decision-making.
A systematic literature review has also revealed the numerous different sources from which Big Data is extracted. Sources vary depending on the domain, which is the source to extract specific kinds of data.
Literature reveals that typical Big Data contains videos, texts, audio, and images at massive levels of datasets. The datasets’ complexity produces a challenge for traditional database management tools to handle the volume of the data that is being analyzed.
Familiar sources for Big Data generation are payment orders, delivery records, invoices, and storage records. However, sources can be “real-time” if it is collected by sensors such as those present in smartphones.
Unstructured data is also commonly seen in Big Data ranging from social media posts, images, text extracts from websites, or even whole websites. Regardless of what type of data it is, the sources from which it is obtained will vary from industry to industry.
Data can come from social media data such as Facebook wall posts, comments, likes, and Twitter tweets, to name a few. Simultaneously, more experimental and scientific sources also provide specific data such as temperature, humidity, and wind speeds data in “real-time” to analyze and make predictions towards climate change.
Hire an Expert Dissertation Writer
Orders completed by our expert writers are
- Formally drafted in the academic style
- 100% Plagiarism-free & 100% Confidential
- Never resold
- Include unlimited free revisions
- Completed to match exact client requirements
Chapter 3: Conceptual Framework
Introduction
The chapter presents the conceptual framework for automobile company executives to adopt. This is achieved using the adopters’ category under the diffusion of innovations theory proposed by Rogers (2003).
Theoretical Development
The diffusion of innovations theory was heavily relied upon to develop the conceptual framework, as Rogers (2003) proposed. Based on the idea, diffusion is the process by which innovation is communicated over some time among those participating in a social system. According to Rogers (2003), four main elements influence the spread of a new idea; innovation, communication channels, time, and a social system. Currently, automobile companies are slowly creeping into Big Data to handle operations, as evident from the literature review. The process of diffusion relies extremely on human capital. This means that innovation needs to be widely adopted within a setting to self-sustain itself.
There are various strategies available to help an innovation reach the stage of critical mass. This includes the strategy of when an innovation is adopted by a highly respective person in an organisation and develops an instinctive desire for a specific innovation. Rogers (2003) argues that one of the best strategies is to place innovation into a group of individuals who can readily use the technology and provide positive reactions resulting in benefits to early adopters. By using the adoption process under innovation theory diffusion, automobile companies can target respected high-level executives to shift their support towards big data initiatives.
Conclusion
The proposed conceptual framework provides automobile companies with strategies that adopt big data initiatives to promote innovation. The best way to do so is to present innovation to highly respectable executives in the company to promote innovation to self-sustain it.
Chapter 4: Methodology
Introduction
The current chapter presents developing the research methods needed to complete the experimentation portion of the current study. The chapter will discuss in detail the various stages of developing the methodology of the current study. This includes a detailed discussion of the philosophical background of the research method chosen. In addition to this, the chapter describes the data collection strategy, including a selection of research instrumentation and sampling. The chapter closes with a discussion on the analysis tools used to analyse the data collected.
Selecting an Appropriate Research Approach
Creswall (2013) stated that research approaches are plans and procedures that range from making broad assumptions to detailed methods of data collection, analysis, and interpretation.
The several decisions involved in the process are used to decide which approach should be used in a specific study that is informed using philosophical assumptions brought to the study (Creswall 2013).
These are procedures of inquiry or research designs and specific research methods used for data collection, its analysis, and finally, its interpretation. However, Guetterman (2015); Lewis (2015); and Creswall (2013) argue that the selection of the specific research approach is based on the nature of the research problem, or the issue that is being addressed by any study, personal experiences of the researchers’, and even the audience for which the study is being developed for.
The main three categories with which research approaches are organised include; qualitative, quantitative, and mixed research methods. Creswall (2013) comments that all three approaches are not considered discrete or distinct.
Creswall (2013) states, “qualitative and quantitative approaches should not be viewed as rigid, distinct categories, polar opposite, or dichotomies” (p.32).
Guetterman (2015) points out that a clearer way of viewing gradations of differences between the approaches is to examine the basic philosophical assumptions brought to the study, the kinds of research strategies used, and the particular methods implemented in conducting the strategy.
Underlying Philosophical Assumptions
An important component of defining the research approach involves philosophical assumptions that contribute to the broad research approach of planning or proposing to conduct research. It involves the intersection of philosophy, research designs, and specific methods, as illustrated in Fig. 1 below.
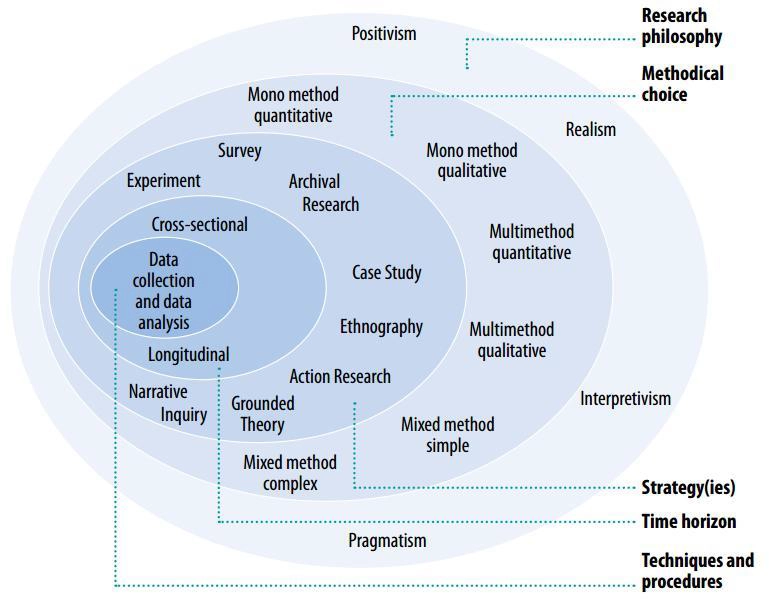
Figure 4.2-1- Research Onion (Source; Saunders and Tosey 2013)
Saunders et al. (2009) define research philosophy as a belief about how data about a phenomenon should be gathered, analyzed, and used. Positivism reflects the acceptance in adopting the philosophical stance of natural scientists (Saunders, 2003).
According to Remenyi et al. (1998), there is a greater preference in working with an “observable social reality” and that the outcome of such research can be “law-like” generalisations that are the same as those which physical and natural scientists produce.
Gill and Johnson (1997) add that it will also emphasise a highly structured methodology to replicate other studies. Dumke (2002) agrees and explains that a positivist philosophical assumption produces highly structured methods and allows for generalisation and quantification of objectives that statistical methods can evaluate.
For this philosophical approach, the researcher is considered an objective observer who should not be impacted by or impact the research subject.
The current study chooses positivist assumptions due to the literature review’s discussion of the importance of Big Data in industrial domains and the need to measure its success in business operations.
To identify a positive relationship between Big Data usage and beneficial business outcomes, the theory needs to be used to generate hypotheses that can later be tested of the relationship, which would allow for explanations of laws that can thereafter be assessed (Bryman and Bell, 2015).
Selecting Interpretive Research Approach
Interpretive research approaches are derived from the research philosophy that is adopted. According to Dumke (2002), the two main research approaches are deductive and inductive.
The inductive approach is commonly referred to when theory is derived from observations. Thus, the research begins with specific observations and measures. It is then from detecting some pattern that a hypothesis is developed.
Dumke (2002) argues that researchers who use an inductive approach usually work with qualitative data and apply various methods to gather specific information that places different views.
From the philosophical assumptions discussed in the previous section, it is reasonable to use the deductive approach for the current study. It is also considered the most commonly used theory to establish a relationship between theory and research. The figure below illustrates the steps used for the process of deduction.
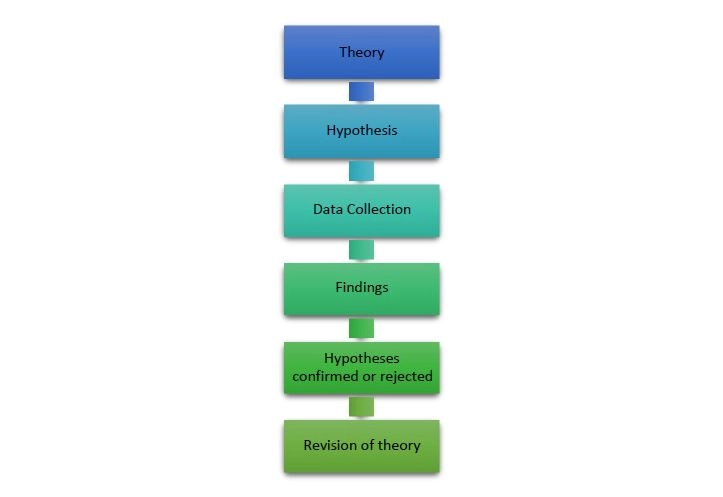
Figure 4.2-2- The process of deduction (Source, Bryman and Bell 2015)
Based on what is known about a specific domain, the theoretical considerations encompassing it a hypothesis or hypotheses are deduced that will later be subjected to empirical inquiry (Daum, 2013). Through these hypotheses, concepts of the subject of interest will be translated into rational entities for a study. Researchers are then able to deduce their hypotheses and convert them into operational terms.
Justifying the Use of Quantitative Research Method
Saunders (2003) notes that almost all research will involve numerical data or even contain data quantified to help a researcher answer their research questions and meet the study’s objectives.
However, quantitative data refers to all data that can be a product of all research strategies (Bryman and Bell, 2015; Guetterman, 2015; Lewis, 2015; Saunders, 2003).
Based on the philosophical assumptions and interpretive research approach, a quantitative research method is the best suited for the current study. Mujis (2010) defends the use of quantitative research because, unlike qualitative research, which argues that there is no pre-existing reality, quantitative assumes that there is only a single reality about a social condition that researchers cannot influence way.
Selecting an Appropriate Research Strategy
There are many strategies available to implement in a study, as evidence by Fig. 1. There are many mono-quantitative methods, such as telephone interviews, web-based surveys, postal surveys, and structured questionnaires (Haq 2014).
Each instrument has its own pros and cons in terms of quality, time, and data cost. Brymand (2006); Driscoll et al. (2007); Edwards et al. (2002); and Newby et al. (2003) note that most researchers use structured questionnaires for data collection they are unable to control or influence respondents, which leads to low response rates but more accurate data obtained.
Saunders and Tosey (2015) have argued that quantitative data is simpler to obtain and more concise to present. Therefore, the current study uses a survey-based questionnaire (See Appendix A).
Justifying the use of Survey Based Questionnaire
Surveys are considered the most traditional forms of research and use in non-experimental descriptive designs that describe some reality. Survey-based questionnaires are often restricted to a representative sample of a potential group of the study’s interest.
In this case, it is the executives currently working for automobile companies in the UK. The survey instrument is then chosen for its effectiveness at being practical and inexpensive (Kelley et al., 2003).
The philosophical assumptions, interpretive approach, and methodological approach are chosen. The current study’s survey design is considered the best instrument in line with these premises and cost-effectively.
Empirical Research Methodology
Research Design
This section describes how research is designed to use the techniques used for data collection, sampling strategy, and data analysis for a quantitative method. Before going into the strategies of data collection and analysis, a set of hypotheses were developed.
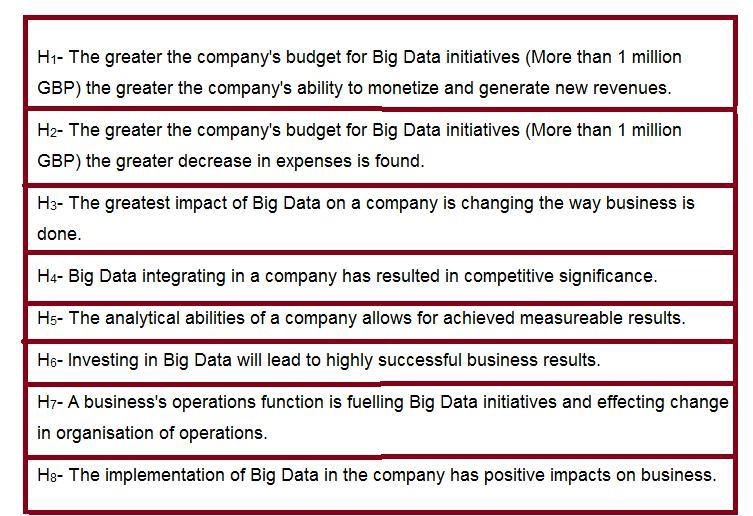
Hypotheses Development
The current study uses a quantitative research approach, making it essential to develop a set of hypotheses that will be used as a test standard for the mono-method quantitative design. The following are a set of hypotheses that have been developed from the examination of the literature review.
Data Collection
This section includes the sampling method used to collect the number of respondents needed to provide information then analysed after collection.
Sampling Method
Collis (2009) explains that there are many kinds of sampling methods that can be used for creating a specific target sample from a population. This current study uses simple random sampling to acquire respondents with which the survey will be conducted.
Simple random sampling is considered the most basic form of probability sampling. Under the method, elements taken from the population are random, with all elements having an equal chance of being selected.
According to the Office of National Statistics (ONS), as of 2014, there are about thirty-five active British car manufacturers in the UK, each having an employee population of 150 or more.
This is why the total population of employees in car manufacturers is estimated to be 5,250 employees. The sample therefore developed, used the following equation;
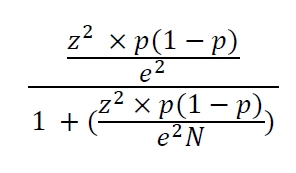
Where; N is the population size, e is a margin of error (as a decimal), z is confidence level (as a z-score), and p is percentage value (as a decimal). Thus, the sample size is with a normal distribution of 50%. With the above equation, a population of 5,250, with a 95% confidence level and 5% margin of error, the total sample size needed for the current equals 300. Therefore, N=300 is the sample size of the current study.
Survey
The survey development (see Appendix A) has a total of three sections, A, B, and C, with a total of 39 questions. Each section has its own set of questions to accomplish.
The survey is a mix of closed-ended questions that comprehend the respondent’s demographic make us, the Big Data initiatives of the company, and the impact that Big Data was having in their company. The survey is designed to take no longer than twenty minutes. The survey was constructed on Survey Monkey.com, an online survey-provided website.
The survey was left on the website for a duration of 3.5 weeks to ensure that a maximum number of respondents answered the survey. The only way the survey was allowed for a respondent is to pass a security question that asks if they are working for an automobile company in the UK to take the survey.
Gupta et al. (2004) believe that web surveys are visual stimuli, and the respondent has complete control concerning whether or how each question is read and understood. That is why Dillman (2000) argued that web questionnaires are expected to resemble those taken through the mail/postal services closely.
Data Analysis
The collected data is then analysed using the Statistical Package for Social Science (SPSS) version 24 for descriptive analysis. The demographic section of the survey will be analysed using descriptive statistics. Further analysis of the data also includes the use of descriptive statistics.
Conclusions
The chapter provides a descriptive and in-depth discussion of the methods involved in the current study’s research. The current study looks towards a quantitative approach that considers positivism as its philosophical undertaking, using deductive reasoning for its interpretive approach, a mono-quantitative method that involves using a survey instrument for data collection.
The methodology chapter also provided the data analysis technique, which is descriptive statistics through frequency analysis and regression analysis.
Chapter 5 Results and Analysis
Introduction
The chapter provides the findings of the current study based on the survey results obtained. It provides a straightforward statement of the results using descriptive statistics, which would later be further analysed using SPSS v.24 software. The need for SPSS is to conduct a regression analysis to provide a detailed examination of the data.
Section A- Demographic Results
The study had called for 300 respondents to answer the survey using Survey Monkey, left online for 3.5 weeks. However, the total completed surveys obtained was 132, making the survey’s response rate only forty-four percent (44%). It was not the best response rate, but it still provided a broad range of participants to analyse.
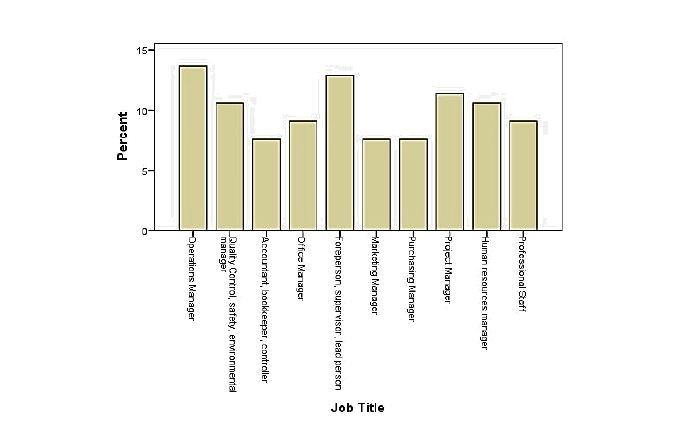
The first question of the survey’s section A called for respondents to identify their job title for the current automobile company that they were working for. Fig. 5.2-1-1 shows that operations managers and supervisors made up the greatest number of respondents in the study.
Operations managers had composed 14 percent of the respondents, followed by the foreperson, supervisor, lead person of 13 percent, and the project managers that made 12 percent of the respondents.
Respondents were also asked to indicate the number of years they have been employed in a specific organisation. Allowing for such insight would provide a sense of experience that the participant may have had while working in the company.
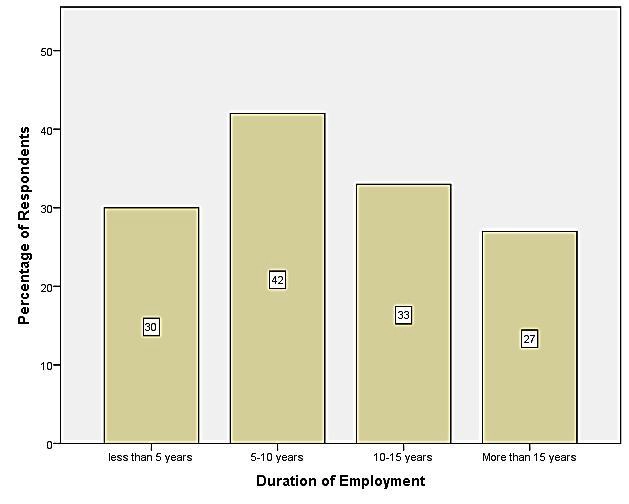
Figure 5.2-2.- How long have you worked for the organization?
This is illustrated in Fig. 5.2-2, in which 42 percent of respondents have indicated that they have worked for the company for five to ten years. Of the respondents, thirty-three percent have indicated that they have worked for their company for 10-15 years, while thirty percent indicated less than five years. The remaining 27 percent indicated employment for over fifteen years.
The survey also asked respondents to indicate the number of employees who worked for the firm ty was employed in. Having such knowledge would allow the researcher to understand the extent of operations conducted in the automobile company. Having such an understanding provides insight into the scope of use in Big Data being implemented in the company (see Fig.5.2-3).
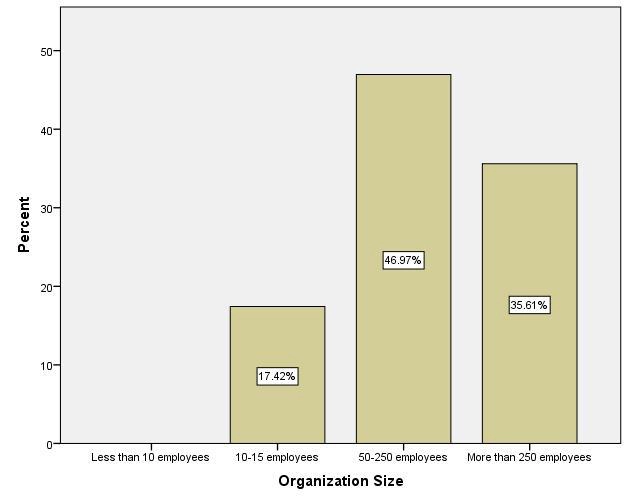
Figure 5.2-3- How many people are employed in the organization you work for?
A total of 46.97 percent of respondents indicated that they worked for companies that employed 50 to 250 employees. Also, 35.61 percent of employees indicated that they were employed by companies with more than 250 employees working for them.
Lastly, 17.42 percent of respondents indicated that the companies they worked for had 10-15 employees. Many respondents indicated that they worked for companies with more than 50 employees, indicating that the companies included in the study are small-to-medium businesses and large enterprises.
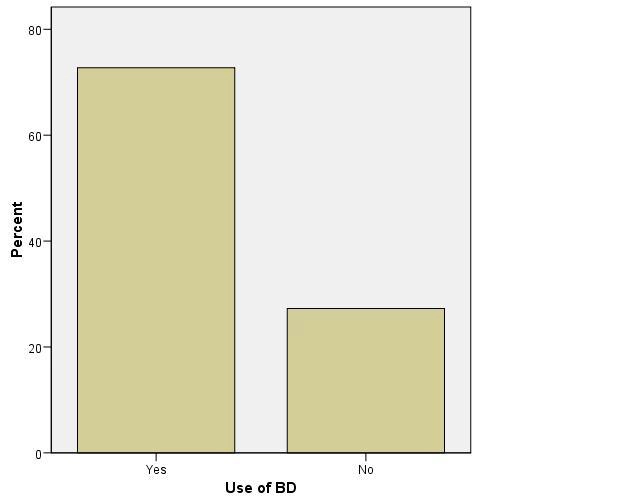
Figure 5.2-4 – Does your company use Big Data analytics?
Of the respondents participating, 72.73 percent indicated that their company was using Big Data analytics. This was crucial as it provided insight into the number of automobile companies with Big Data analytic systems.
As seen in Fig. 5.2.-5, only eighty-one (81) respondents from 132 had direct exposure to Big Data to either analyse, visualise, or make business decisions based on it. The pool of respondents was considerably smaller than anticipated.
Still, these slight details will provide greater insight into automobile companies’ workings regarding their use or integration of Big Data into the company. Based on the demographic analysis, participants who completed their survey had some access to Big Data analysis. But there is still a large group of people in these companies that do not have any exposure or access to Big Data.
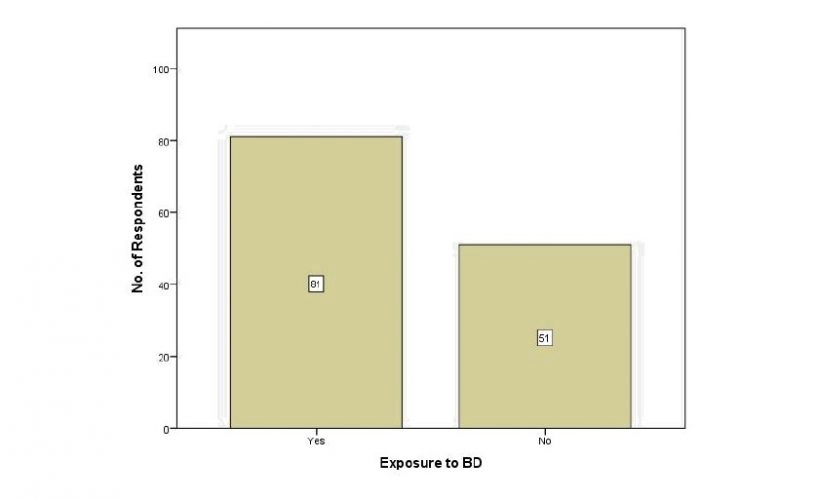
Figure 5.2-5 – Have you ever been exposed to using any form of Big Data in terms of analyzing it, visualizing it, or making decisions based on it?
Section B & C- Company Big Data Initiative and Impacts Results
The next section of the questionnaire, section B, aimed to analyse the respondent’s answers to identify the extent of integration or implementation of Big Data initiatives in the automobile company they worked for.
This section aims to understand the extent to which Big Data is present in automobile companies. This information can compare with the next team, which looks to understand and examine the effects of big data initiatives in the company.
Fig. 5.3-1 illustrates the main issues that may have caused the automobile company to implement Big Data initiatives. Based on the graph, it is concluded that analysing streaming data and data sets greater than 1 Terabyte (TB) were the greatest cause of initiating Big Data into the company, as per the response of 19.70 percent of respondents, respectively.
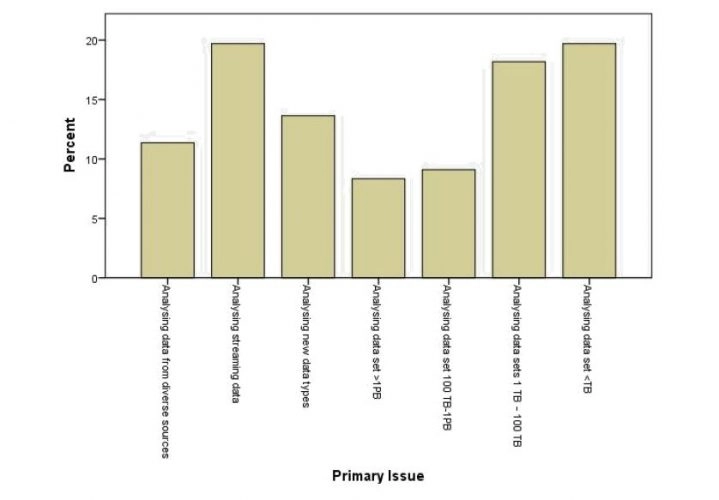
Figure 5.3-1- What were the organization’s primary data issues that led it to consider Big Data?
Another issue that instigated Big Data analytics in companies was analysing data sets from 1 TB to 100 TB, as indicated by 18.18 percent of respondents. Next in the rank was analysing new data types, which led to using Big Data analytics as indicated by 13.64 percent of respondents.
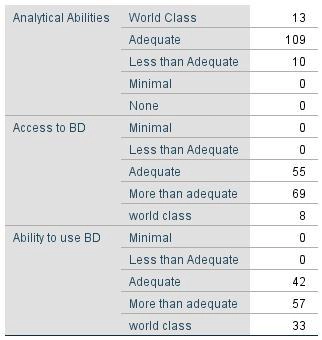
Fig. 5.3-2 illustrates the reaction of respondents to two questions.
- Questions 2. How would you rate the analytical abilities of the company you are employed in?
- Question 5. How would you rate the access to relevant, accurate, and timely data in your company today?
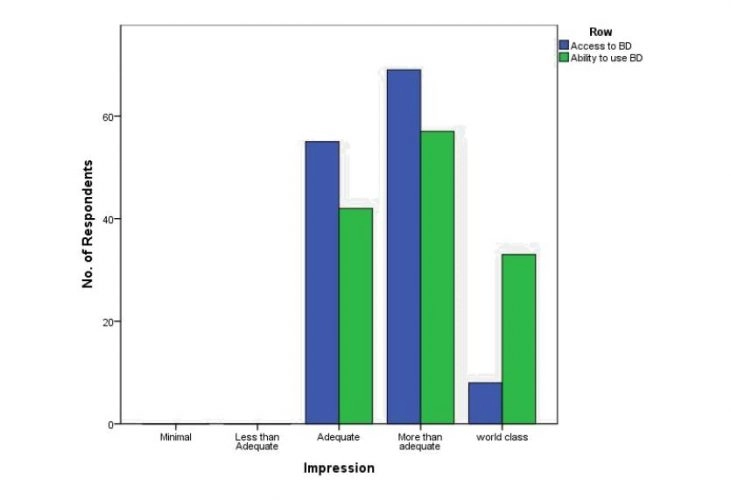
Figure 5.3-2 – How would you rate the analytical abilities of the company you are employed in? How would you rate the access to relevant, accurate, and timely data in your company today?
There is a strong correlation between access to Big Data and the analytical abilities of the company. Based on the illustration, 55 people who had access to Big Data thought the access was adequate, with 42 of them believing that its analytical ability was adequate. Furthermore, 69 participants indicated that access to Big Data was more than adequate, with 57 participants believing that the firm’s analytical ability was more than adequate. It can be concluded that the greater the access to Big Data, the adequate or more adequate the analytical abilities of the firm.
The next graph indicates the amount of spending that is placed on a Big Data initiative’s budget. Oftentimes, it was seen, as from the literature review, that funding Big Data analytics in a company allowed for greater business gains. Therefore, it was essential to understand the budget amount that was invested in Big Data initiatives.
A majority of respondents, about 47 percent, indicated that their company had a Big Data initiative budget of £1 million to GBP 10 million. Another 40 percent of respondents have indicated that their company spent £100,000 to GBP 1 million on their Big Data systems.
The amount of staff dedicated to Big Data analytics is also thought to play a part in advancing the goals that may be set for an automobile company regarding Big Data. The figure below takes two questions;
Questions 7- Approximately how many staff in your company are dedicated to analytics, modelling, data mining (not including routine reporting)?
Question 8- Of these staff, are you mostly working in or for your consumer-facing (B2C) businesses, your commercial or wholesale (B2B) businesses, or both?
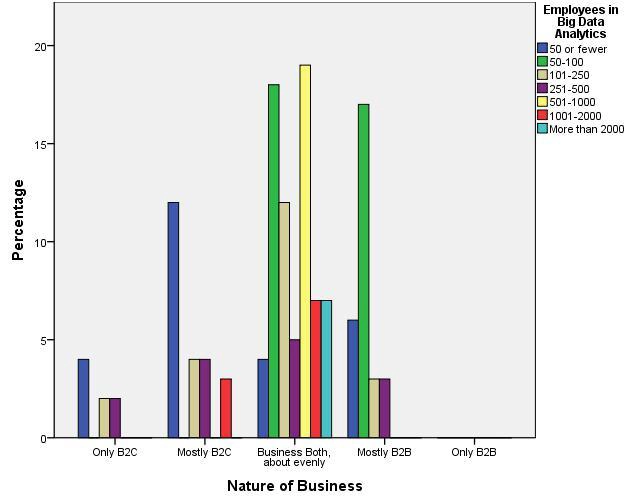
Figure 5.3-4 Approximately how many staff in your company are dedicated to analytics, modeling, data mining (not including routine reporting)? Of these staff, are you mostly working in or for your consumer-facing (B2C) businesses, your commercial or wholesale (B2B) businesses, or both?
Based on the illustration, nineteen (19) respondents indicated that 501-1000 employees are dedicated to B2B and B2C analytics. Using Big Data analytics for both B2B and B2C comprises the most agreement of respondents, with 72 of 132 indicated so.
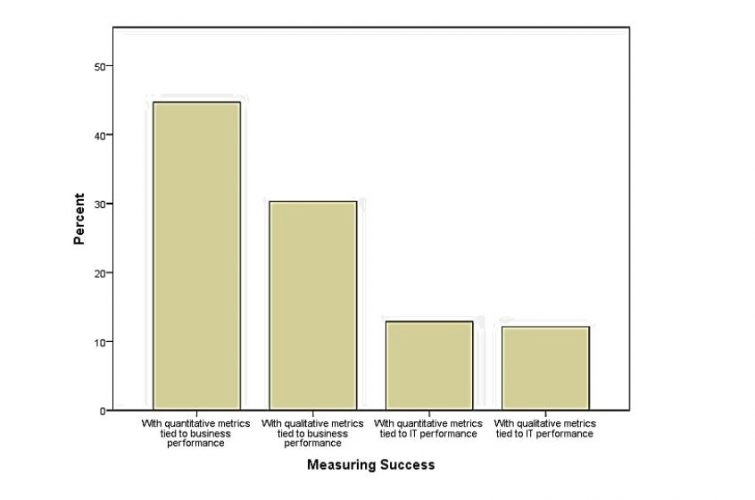
Figure 5.3-5 How does the company plan to measure the success of your Big Data initiatives?
The figure above represents the respondent’s answers to their automobile company’s plan for measuring Big Data’s success. Of the 132 participants, 44.70 percent responded that the company is planning on using quantitative metrics associated with business performance to analyse if Big Data is actually successful.
Another 30.30 percent indicated that their company was planning on using qualitative metrics tied to business performance. Using business performance to analyse Big Data’s success is coherent to the results of the literature review that indicated previous studies of doing such.
As an automobile company, they need to know the results of using Big Data analytics, and that is only by using business performance indicators regardless of being qualitative or quantitative.
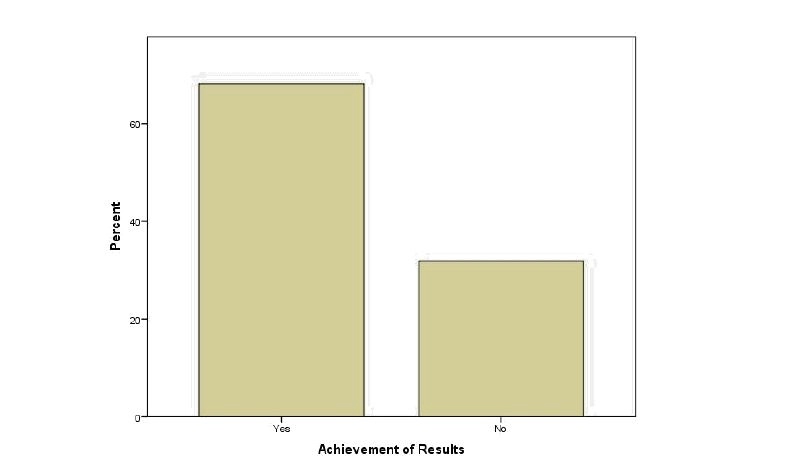
Figure 5.3-6 Has the company achieved measurable results from its investments in Big Data?
Fig. 5.3-6 portrays the response of participants regarding achieving measurable results from Big Data. According to 68.18percentt of the respondents,s the company they worked for did indeed show measurable results from their Big Data investments.
However, 31.82 percent indicated that there was indeed no measurable result in investing in Big Data. Based on these results and those presented in 5.3-2, the results support H5, which states that a company’s analytical abilities allow for measurable results.
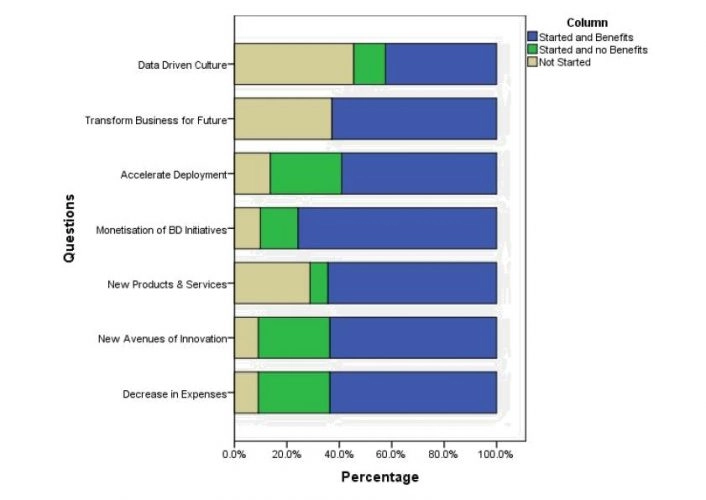
Figure 5.3-7: Impact of Big Data on Company
Fig. 5.3-7 presents the answers of respondents of the impact of Big Data on automobile companies. An estimate of 60% of participants indicated that Big Data initiatives had been started, and the company has benefited from a decrease in expenses.
This response, coupled with the responses seen in Fig. 5.3-3, supports hypothesis H2 that the greater company’s budget (>1million GBP) would decrease expenses.
Also, over 70% of respondents indicate that their companies had started and benefited from Big Data initiatives by monetising from the initiatives. These results, coupled with those presented in Fig. 5.3-3, supports H1, which suggested that larger investments (<1million GBP) would result in the company’s ability to monetise and generate new revenues.
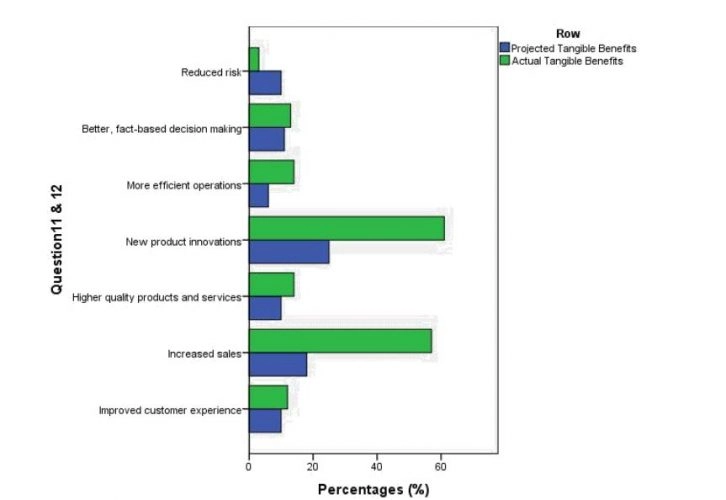
Figure 5.3-8: Questions 11 & 12 11. Since the Big Data initiatives implemented, what tangible benefits have been achieved in the company? What are the tangible benefits the company is aiming to achieve using Big Data initiatives?
Fig. 5.3-8 presents the actual and projected benefits of Big Data initiatives. Over 60% of respondents indicated that their automobile company had witnessed actual benefits in increasing sales and product innovations since their Big Data initiatives.
Other benefits that overcame project benefits include improved customer experience, higher quality products/services, efficient operations, and improved decision making. Coupled with the results from 5.3-3, the data support hypotheses H6 and H8.
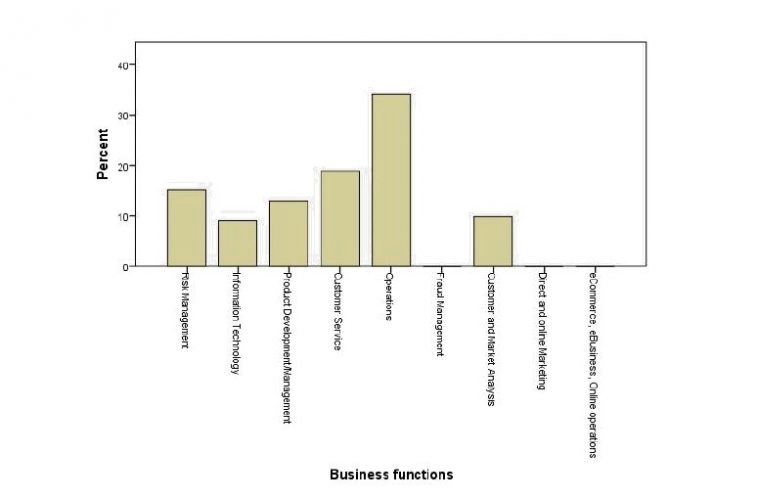
Figure 5.3-9: What business functions in the company are fueling Big Data initiatives?
Fig. 5.3-9 presents the results of question 13 in section C of the questionnaire. Respondents were asked which business function may be fueling the drive for Big Data initiatives.
The sample, 34.09%, indicated that operations were the main business function fueling Big Data in the company. After operations, the second-highest function is customer service, with 18.94% of respondents indicating this.
The business function thought to be the least influential in driving Big Data in automobile companies was Information Technology, with 9.09% indicating it.
The results of this partially support H7 because according to question 15 section C, 25% of respondents indicated that in the next five years, Big Data would impact and fundamentally change the way business is done in the organisation as opposed to 15.91% of respondents that indicated it would change the way the business will organise operations.
Conclusion
Based on the study results, hypotheses H1, H2, H5, H6, H8, and part of H7 have been supported. This leads to the conclusion that Big Data initiatives in automobile companies have had a significant impact on the company’s operations.
The companies have significantly benefited from increased sales, greater product innovations, improved customer care, and efficient decision-making. Greater investment of more than 1 billion GBP has led to better results obtained from Big Data initiatives.
If you need assistance with writing your dissertation, our professional dissertation writers are here to help!
Chapter 6: Conclusion and Discussion
Research Overview
The current study aimed to analyze the impact that Big Data initiatives had on automobile companies in the UK, especially its operations. The current study was developed using a quantitative approach, which meant using philosophical assumptions from the positivist school of thought and producing a methodology that would follow deductive reasoning.
Under these assumptions, the quantitative approach was selected and used the survey instrument to gather data. This data was then analyzed using descriptive statistics to examine the results and link it to a set of proposed hypotheses.
The results presented conclude that investing more than 1 billion GBP on Big Data initiatives would provide greater tangible benefits for a business and positively impact the company.
The results also found that companies with greater analytical abilities on the adequate and above adequate range could see measurable results. In the end, Big Data did have a positive and large impact on the operations business function of automobile companies.
Meeting the Aim and Objectives of the Project
The research’s main aim was to investigate the impact of Big Data on the automobile industry, specifically in the UK, operations such as sales, customer retention, the manufacturing process, performance, marketing, logistics, and supply chain management.
The current study was able to accomplish this using the objectives. The study’s aims and objectives were supported by the revelation that the following hypotheses are supported by the results and analysis in Chapter 5.
H1- The greater the company’s budget for Big Data initiatives (More than 1 million GBP), the greater its ability to monetize and generate new revenues.
H2- The greater the company’s budget for Big Data initiatives (More than 1 million GBP), the greater decrease in expenses is found.
H5- The analytical abilities of a company allow for achieved measurable results.
H6- Investing in Big Data will lead to highly successful business results.
H7- A business’s operations function is fueling Big Data initiatives.
H8- The implementation of Big Data in the company has positive impacts on business.
Statement of Contributions and Research Novelty
Based on the literature review conducted in chapter 2, there is little to no academic research on Big Data’s impact on automobile companies. Due to this significant gap in research, the current study can contribute to literature using the insight provided by this study’s results.
The study analyzed how executives in automobile companies in the UK perceive the contributions made by Big Data in their companies. This insight can then be used to attract other researchers to study the phenomena. Big Data and its emergence in the current markets is fairly new, making the idea behind the current a novel idea.
Research Limitations
The research was severely limited due to the number of respondents being a lot less than those proposed; 300 respondents were needed; however, only 132 had completed the survey.
This may be because the survey was distributed online. This makes it difficult to tell how many people had seen the survey link but had not participated. The idea that the survey may have been too long, making respondents weary of answering the questions due to the great length of time it took to answer.
Due to the sample constraint, the results obtained from the current study cannot be generalized to the population sampled. It is recommended that other forms of distributing surveys be used to garner the maximum number of respondents.
There is also the inability of automobile companies to speak to researchers on the phone, which led to the drop in using interviews in the study. With interviews, a greater deal of insight can be brought to the results obtained from the survey. Complementing these would have made the results of the study more accurate and reliable.
Recommendations for Future Research
It is recommended that future studies take into account the loopholes of the current study. From the literature review, very little literature is available on the impact of Big Data on automobile companies.
Due to this lack, future researchers are encouraged to research this industry because drastic changes may result in increased use of Big Data. Future researchers are recommended to use a mixed-methods approach to obtaining and analyzing data.
With a mixed-methods approach, qualitative and quantitative data can complement each other to make assumptions stronger and test hypotheses in a highly effective manner.
References
Abusharekh, A., Stewart, S. A., Hashemian, N., Abidi, S. S. R. 2015. H-Drive: A big health data analytics platform for evidence-informed decision making. IEEE International Congress on Big Data, p. 416- 432.
Aihara, K., Imura, H., Takasu, A., Tanaka, Y., Adachi, J. 2014. Crowdsourced mobile sensing in smarter city life. IEEE 7th International Conference on Service-Oriented Computing and Applications, p. 334- 337.
Amelia, A., and Saptawati, G. A. P. 2014. Detection of potential traffic jams based on traffic characteristic data analysis. IEEE, p. 1- 5.
Bryman, A., Bell, E., 2015. Business Research Methods. Oxford University Press.
Cook, K., Grinstein, G., Whiting, M., Cooper, M., Having, P., Ligget, K., Nebesh, B., and Paul, C. L. 2012. VAST Challenge 2012: Visual Analytics for Big Data. IEEE Symposium on Visual Analytics Science and Technology 2012, p. 251- 257. Seattle, WA: Print.
Daum, P., 2013. International Synergy Management: A Strategic Approach for Raising Efficiencies in the Cross-border Interaction Process. Anchor Academic Publishing (aap_verlag).
Dümke, R., 2002. Corporate Reputation and its Importance for Business Success: A European Perspective and its Implication for Public Relations Consultancies. diplom.de.
Foy, H. 2014. UK’s resurgent car industry still faces challenges. Financial Times.
Guetterman, T.C., 2015. Descriptions of Sampling Practices Within Five Approaches to Qualitative Research in Education and the Health Sciences. Forum Qualitative Sozialforschung / Forum: Qualitative Social Research 16.
Haq, M., 2014. A Comparative Analysis of Qualitative and Quantitative Research Methods and a Justification for Adopting Mixed Methods in Social Research (PDF Download Available). ResearchGate 1–22. doi:http://dx.doi.org/10.13140/RG.2.1.1945.8640
Itoh, M., Yokoyama, D., Toyoda, M., and Tomita, Y. 2014. Visual fusion of Mega-City Big Data: An application to traffic and tweets data analysis of Metro passengers. IEEE International Conference on Big Data, p. 431-442.
Kerr, K., Hausman, B. L., Gad, S., and Javen, W. 2013. Visualization and rhetoric: key concerns for utilizing bid data in humanities research- A case study of vaccination discourse 1918-1919. IEEE International Conference on Big Data, p.25- 32.
Kelley, K., Clark, B., Brown, V., Sitzia, J., 2003. Good practice in the conduct and reporting of survey research. Int J Qual Health Care 15, 261–266. doi:10.1093/intqhc/mzg031.
Lee, J., Noh, G., Kim, C. K. 2014. Analysis & visualization of movie’s popularity and reviews. IEEE International Conference on Big Data, pp. 189-190.
Lewis, S., 2015. Qualitative Inquiry and Research Design: Choosing Among Five Approaches. Health Promotion Practice 16, 473–475. doi:10.1177/1524839915580941
Liu, D., Kitamura, Y., Zeng, X. 2015. Analysis and visualization of traffic conditions of the road network by route bus probe data. IEEE International Conference on Multimedia Big Data, p. 248-251.
Lorenzo, G. D., Sbodio, M. L., Calabrese, F., Berlongerio, M., Nair, R., and Pinelli, F.
2014. All aboard: Visual exploration of cellphone mobility data to optimize public transport.
IUI Haifa, Israel, p. 335- 340. Print.
Monaghan, A. 2016. UK car manufacturing hits high but industry warns of Brexit effect. The Guardian. [online] < https://www.theguardian.com/business/2016/jul/28/uk-car-manufacturing-hits-high-industry-warns-brexit-effect >. [Accessed : 2017 March 2].
Pu, J., Liu, S., Qu, H., Ni, L. 2013. T-watcher: A new visual analytic system for effective traffic surveillance. IEEE 14th International Conference on Mobile Data Management, p. 127- 136.
Rysavy, S. J., Bromley, D., and Daggett, V. 2014. DIVE: A graph-based visual analytics framework for Big Data. Visual Analytics for Biological Data, IEEE Computer Graphics and Applications, p. 26-37.
Saunders, M., 2003. Research Methods for Business Students. Pearson Education India.
Saunders, M.N.K., Tosey, P., 2015. Handbook of Research Methods on Human Resource Development. Edward Elgar Publishing.
Shah, A. H., Gopalakrishnan, G., Rajendran, A., and Liebel, U. 2014. Data mining and sharing tool for high content screening large scale biological image data. IEEE International Conference on Big Data, p. 1068- 1076.
Steiger, E., Ellersiek, T., and Sipf, A. 2014. Explorative public transport flow analysis from uncertain social media data. SIGSPATAL, p. 1-7. Print.
Walker, R. 2015. From Big Data to Big Profits (1st ed.). Print.
Wallner, G., and Kriglstein, S. 2013. Visualization-based analysis of gameplay data- A review of the literature. Entertainment Computing, 4, pp. 143-155.
Wozniak, P., Valton, R., Fjeld, M. 2015. Volvo single view of vehicle: Building a Big Data service from scratch in the automotive industry. CHI: Crossings, Seoul, Korea, p. 671-678.
Xiao, S., Liu, C. X., Wang, Y. 2015. Data driven geospatial-enabled transportation platform for freeway performance. IEEE Intelligent Transportation Systems Magazine, p. 10-21.
Zhang, Z., Wang, S., Cao, G., Padmanabhan, A., and Wu, K. 2014. A scalable approach to extracting mobility patterns from social media data. National Science Foundation, p. 1-6. Print.
9 Appendix A- Survey
Please contact us to get access to the full Appendix Survey.
10 Appendix B- Raw Data
Please contact us to get access to the full Appendix Survey.
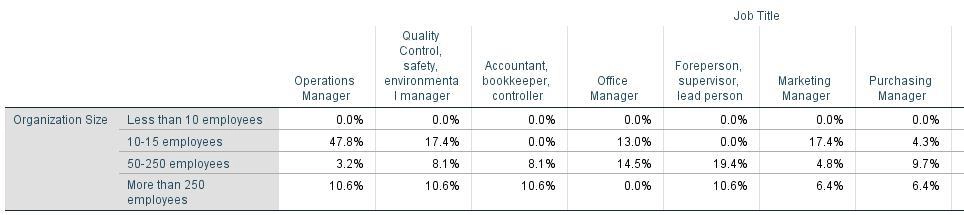
11 Appendix C- Responses Job Title x Organization Size
12 Appendix D- Responses Question 2, 5, & 6
Frequently Asked Questions
The time required to write a master’s level full dissertation varies, but it typically takes 6-12 months, depending on research complexity and individual pace.